Immigrants from Northern Europe vs Crow Male Poverty
COMPARE
Immigrants from Northern Europe
Crow
Male Poverty
Male Poverty Comparison
Immigrants from Northern Europe
Crow
9.7%
MALE POVERTY
99.5/ 100
METRIC RATING
33rd/ 347
METRIC RANK
19.1%
MALE POVERTY
0.0/ 100
METRIC RATING
338th/ 347
METRIC RANK
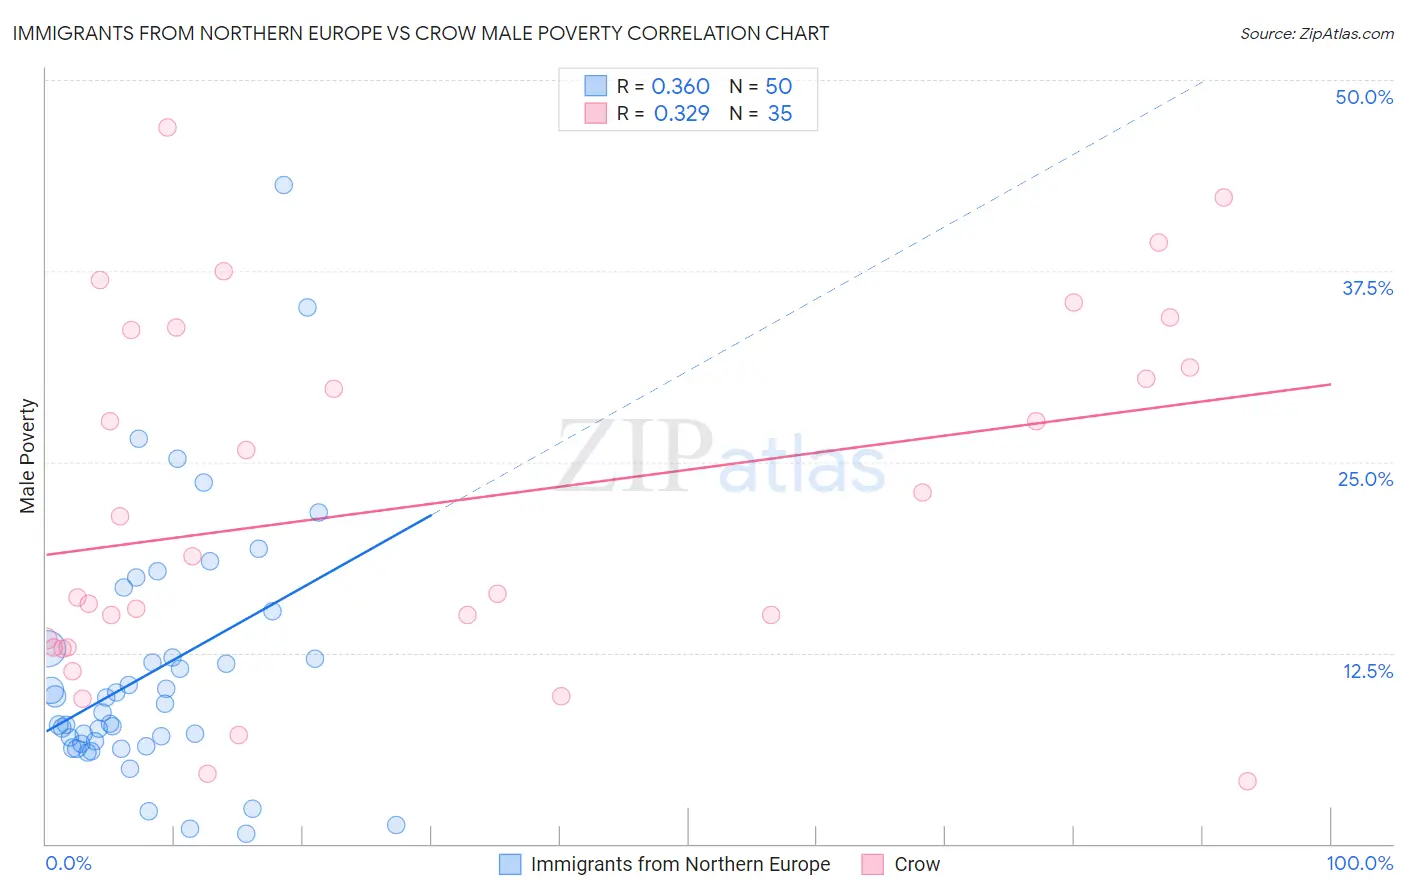
Immigrants from Northern Europe vs Crow Male Poverty Correlation Chart
The statistical analysis conducted on geographies consisting of 476,600,632 people shows a mild positive correlation between the proportion of Immigrants from Northern Europe and poverty level among males in the United States with a correlation coefficient (R) of 0.360 and weighted average of 9.7%. Similarly, the statistical analysis conducted on geographies consisting of 59,196,119 people shows a mild positive correlation between the proportion of Crow and poverty level among males in the United States with a correlation coefficient (R) of 0.329 and weighted average of 19.1%, a difference of 96.3%.
Male Poverty Correlation Summary
| Measurement | Immigrants from Northern Europe | Crow |
| Minimum | 0.64% | 4.1% |
| Maximum | 43.1% | 46.9% |
| Range | 42.5% | 42.8% |
| Mean | 11.3% | 22.4% |
| Median | 8.9% | 18.8% |
| Interquartile 25% (IQ1) | 6.5% | 12.8% |
| Interquartile 75% (IQ3) | 12.7% | 33.6% |
| Interquartile Range (IQR) | 6.2% | 20.8% |
| Standard Deviation (Sample) | 8.3% | 11.6% |
| Standard Deviation (Population) | 8.3% | 11.5% |
Similar Demographics by Male Poverty
Demographics Similar to Immigrants from Northern Europe by Male Poverty
In terms of male poverty, the demographic groups most similar to Immigrants from Northern Europe are Macedonian (9.7%, a difference of 0.090%), Immigrants from Poland (9.8%, a difference of 0.15%), Tongan (9.7%, a difference of 0.29%), Polish (9.7%, a difference of 0.31%), and Greek (9.7%, a difference of 0.39%).
| Demographics | Rating | Rank | Male Poverty |
| Burmese | 99.6 /100 | #26 | Exceptional 9.7% |
| Danes | 99.6 /100 | #27 | Exceptional 9.7% |
| Immigrants | Korea | 99.6 /100 | #28 | Exceptional 9.7% |
| Greeks | 99.6 /100 | #29 | Exceptional 9.7% |
| Poles | 99.5 /100 | #30 | Exceptional 9.7% |
| Tongans | 99.5 /100 | #31 | Exceptional 9.7% |
| Macedonians | 99.5 /100 | #32 | Exceptional 9.7% |
| Immigrants | Northern Europe | 99.5 /100 | #33 | Exceptional 9.7% |
| Immigrants | Poland | 99.5 /100 | #34 | Exceptional 9.8% |
| Iranians | 99.4 /100 | #35 | Exceptional 9.8% |
| Czechs | 99.4 /100 | #36 | Exceptional 9.8% |
| Immigrants | Greece | 99.3 /100 | #37 | Exceptional 9.8% |
| Immigrants | Pakistan | 99.2 /100 | #38 | Exceptional 9.9% |
| Russians | 99.2 /100 | #39 | Exceptional 9.9% |
| Cypriots | 99.2 /100 | #40 | Exceptional 9.9% |
Demographics Similar to Crow by Male Poverty
In terms of male poverty, the demographic groups most similar to Crow are Yuman (19.5%, a difference of 2.2%), Sioux (18.7%, a difference of 2.3%), Pueblo (18.5%, a difference of 3.4%), Immigrants from Yemen (20.1%, a difference of 5.3%), and Lumbee (20.2%, a difference of 5.6%).
| Demographics | Rating | Rank | Male Poverty |
| Ute | 0.0 /100 | #331 | Tragic 16.2% |
| Houma | 0.0 /100 | #332 | Tragic 16.7% |
| Natives/Alaskans | 0.0 /100 | #333 | Tragic 16.9% |
| Cheyenne | 0.0 /100 | #334 | Tragic 17.6% |
| Apache | 0.0 /100 | #335 | Tragic 17.7% |
| Pueblo | 0.0 /100 | #336 | Tragic 18.5% |
| Sioux | 0.0 /100 | #337 | Tragic 18.7% |
| Crow | 0.0 /100 | #338 | Tragic 19.1% |
| Yuman | 0.0 /100 | #339 | Tragic 19.5% |
| Immigrants | Yemen | 0.0 /100 | #340 | Tragic 20.1% |
| Lumbee | 0.0 /100 | #341 | Tragic 20.2% |
| Pima | 0.0 /100 | #342 | Tragic 20.4% |
| Yup'ik | 0.0 /100 | #343 | Tragic 20.4% |
| Hopi | 0.0 /100 | #344 | Tragic 20.8% |
| Puerto Ricans | 0.0 /100 | #345 | Tragic 22.0% |