Immigrants from Bangladesh vs Crow Male Poverty
COMPARE
Immigrants from Bangladesh
Crow
Male Poverty
Male Poverty Comparison
Immigrants from Bangladesh
Crow
14.1%
MALE POVERTY
0.0/ 100
METRIC RATING
305th/ 347
METRIC RANK
19.1%
MALE POVERTY
0.0/ 100
METRIC RATING
338th/ 347
METRIC RANK
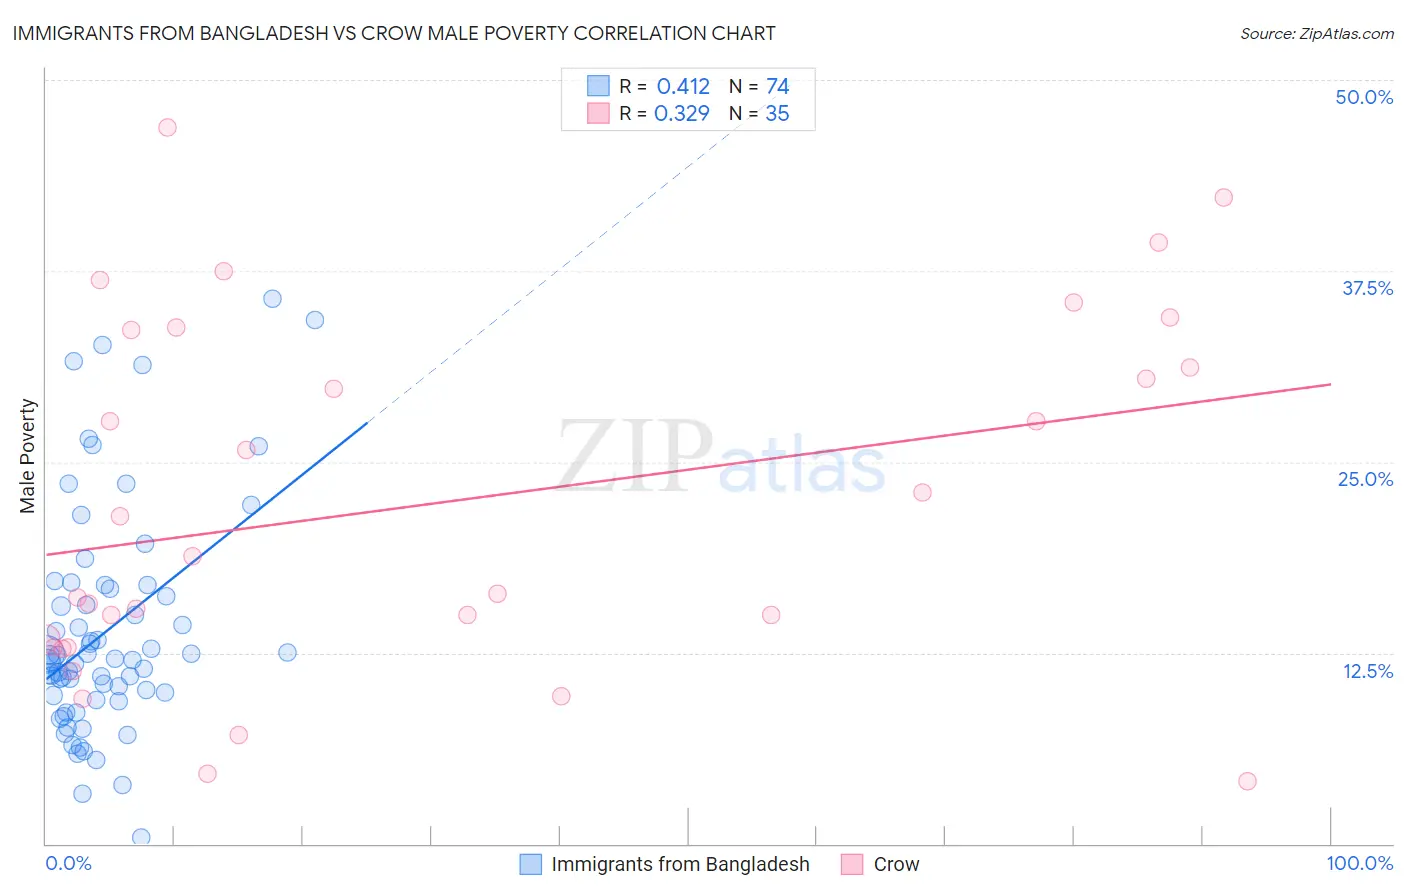
Immigrants from Bangladesh vs Crow Male Poverty Correlation Chart
The statistical analysis conducted on geographies consisting of 203,544,271 people shows a moderate positive correlation between the proportion of Immigrants from Bangladesh and poverty level among males in the United States with a correlation coefficient (R) of 0.412 and weighted average of 14.1%. Similarly, the statistical analysis conducted on geographies consisting of 59,196,119 people shows a mild positive correlation between the proportion of Crow and poverty level among males in the United States with a correlation coefficient (R) of 0.329 and weighted average of 19.1%, a difference of 35.7%.
Male Poverty Correlation Summary
| Measurement | Immigrants from Bangladesh | Crow |
| Minimum | 0.44% | 4.1% |
| Maximum | 35.7% | 46.9% |
| Range | 35.2% | 42.8% |
| Mean | 13.9% | 22.4% |
| Median | 12.1% | 18.8% |
| Interquartile 25% (IQ1) | 9.7% | 12.8% |
| Interquartile 75% (IQ3) | 16.7% | 33.6% |
| Interquartile Range (IQR) | 7.0% | 20.8% |
| Standard Deviation (Sample) | 7.4% | 11.6% |
| Standard Deviation (Population) | 7.3% | 11.5% |
Similar Demographics by Male Poverty
Demographics Similar to Immigrants from Bangladesh by Male Poverty
In terms of male poverty, the demographic groups most similar to Immigrants from Bangladesh are Creek (14.1%, a difference of 0.070%), Senegalese (14.1%, a difference of 0.21%), Bahamian (14.1%, a difference of 0.32%), Immigrants from Caribbean (14.0%, a difference of 0.36%), and Immigrants from Senegal (14.0%, a difference of 0.42%).
| Demographics | Rating | Rank | Male Poverty |
| Blackfeet | 0.0 /100 | #298 | Tragic 14.0% |
| Immigrants | Guatemala | 0.0 /100 | #299 | Tragic 14.0% |
| Immigrants | Mexico | 0.0 /100 | #300 | Tragic 14.0% |
| Immigrants | Senegal | 0.0 /100 | #301 | Tragic 14.0% |
| Immigrants | Caribbean | 0.0 /100 | #302 | Tragic 14.0% |
| Bahamians | 0.0 /100 | #303 | Tragic 14.1% |
| Senegalese | 0.0 /100 | #304 | Tragic 14.1% |
| Immigrants | Bangladesh | 0.0 /100 | #305 | Tragic 14.1% |
| Creek | 0.0 /100 | #306 | Tragic 14.1% |
| Dutch West Indians | 0.0 /100 | #307 | Tragic 14.2% |
| Africans | 0.0 /100 | #308 | Tragic 14.2% |
| Somalis | 0.0 /100 | #309 | Tragic 14.3% |
| Seminole | 0.0 /100 | #310 | Tragic 14.3% |
| Hondurans | 0.0 /100 | #311 | Tragic 14.3% |
| Choctaw | 0.0 /100 | #312 | Tragic 14.4% |
Demographics Similar to Crow by Male Poverty
In terms of male poverty, the demographic groups most similar to Crow are Yuman (19.5%, a difference of 2.2%), Sioux (18.7%, a difference of 2.3%), Pueblo (18.5%, a difference of 3.4%), Immigrants from Yemen (20.1%, a difference of 5.3%), and Lumbee (20.2%, a difference of 5.6%).
| Demographics | Rating | Rank | Male Poverty |
| Ute | 0.0 /100 | #331 | Tragic 16.2% |
| Houma | 0.0 /100 | #332 | Tragic 16.7% |
| Natives/Alaskans | 0.0 /100 | #333 | Tragic 16.9% |
| Cheyenne | 0.0 /100 | #334 | Tragic 17.6% |
| Apache | 0.0 /100 | #335 | Tragic 17.7% |
| Pueblo | 0.0 /100 | #336 | Tragic 18.5% |
| Sioux | 0.0 /100 | #337 | Tragic 18.7% |
| Crow | 0.0 /100 | #338 | Tragic 19.1% |
| Yuman | 0.0 /100 | #339 | Tragic 19.5% |
| Immigrants | Yemen | 0.0 /100 | #340 | Tragic 20.1% |
| Lumbee | 0.0 /100 | #341 | Tragic 20.2% |
| Pima | 0.0 /100 | #342 | Tragic 20.4% |
| Yup'ik | 0.0 /100 | #343 | Tragic 20.4% |
| Hopi | 0.0 /100 | #344 | Tragic 20.8% |
| Puerto Ricans | 0.0 /100 | #345 | Tragic 22.0% |