Immigrants from Jordan vs Immigrants from Senegal Male Poverty
COMPARE
Immigrants from Jordan
Immigrants from Senegal
Male Poverty
Male Poverty Comparison
Immigrants from Jordan
Immigrants from Senegal
10.8%
MALE POVERTY
77.5/ 100
METRIC RATING
139th/ 347
METRIC RANK
14.0%
MALE POVERTY
0.0/ 100
METRIC RATING
301st/ 347
METRIC RANK
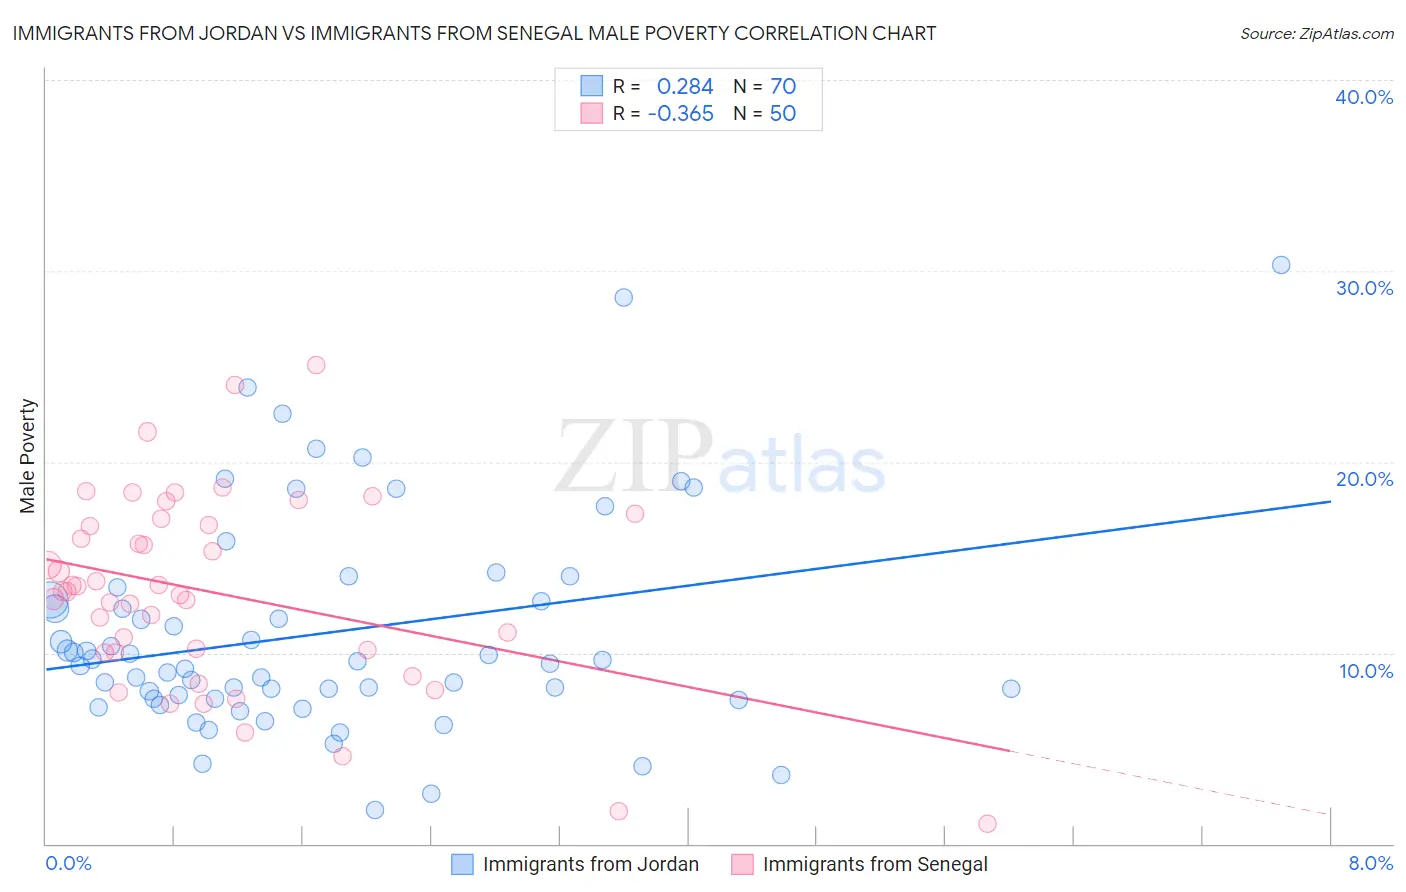
Immigrants from Jordan vs Immigrants from Senegal Male Poverty Correlation Chart
The statistical analysis conducted on geographies consisting of 181,249,904 people shows a weak positive correlation between the proportion of Immigrants from Jordan and poverty level among males in the United States with a correlation coefficient (R) of 0.284 and weighted average of 10.8%. Similarly, the statistical analysis conducted on geographies consisting of 90,120,671 people shows a mild negative correlation between the proportion of Immigrants from Senegal and poverty level among males in the United States with a correlation coefficient (R) of -0.365 and weighted average of 14.0%, a difference of 29.4%.
Male Poverty Correlation Summary
| Measurement | Immigrants from Jordan | Immigrants from Senegal |
| Minimum | 1.8% | 1.1% |
| Maximum | 30.3% | 25.1% |
| Range | 28.5% | 24.0% |
| Mean | 11.0% | 13.1% |
| Median | 9.5% | 13.2% |
| Interquartile 25% (IQ1) | 7.6% | 10.0% |
| Interquartile 75% (IQ3) | 12.7% | 16.7% |
| Interquartile Range (IQR) | 5.2% | 6.7% |
| Standard Deviation (Sample) | 5.7% | 5.1% |
| Standard Deviation (Population) | 5.7% | 5.0% |
Similar Demographics by Male Poverty
Demographics Similar to Immigrants from Jordan by Male Poverty
In terms of male poverty, the demographic groups most similar to Immigrants from Jordan are Yugoslavian (10.8%, a difference of 0.12%), Tlingit-Haida (10.9%, a difference of 0.19%), Immigrants from France (10.9%, a difference of 0.23%), Immigrants from Switzerland (10.8%, a difference of 0.27%), and Basque (10.9%, a difference of 0.40%).
| Demographics | Rating | Rank | Male Poverty |
| Immigrants | Vietnam | 83.0 /100 | #132 | Excellent 10.8% |
| Pakistanis | 83.0 /100 | #133 | Excellent 10.8% |
| New Zealanders | 82.9 /100 | #134 | Excellent 10.8% |
| Brazilians | 82.7 /100 | #135 | Excellent 10.8% |
| Immigrants | Israel | 80.9 /100 | #136 | Excellent 10.8% |
| Immigrants | Switzerland | 79.2 /100 | #137 | Good 10.8% |
| Yugoslavians | 78.2 /100 | #138 | Good 10.8% |
| Immigrants | Jordan | 77.5 /100 | #139 | Good 10.8% |
| Tlingit-Haida | 76.1 /100 | #140 | Good 10.9% |
| Immigrants | France | 75.8 /100 | #141 | Good 10.9% |
| Basques | 74.6 /100 | #142 | Good 10.9% |
| Afghans | 71.9 /100 | #143 | Good 10.9% |
| Samoans | 71.8 /100 | #144 | Good 10.9% |
| Immigrants | Germany | 71.6 /100 | #145 | Good 10.9% |
| Syrians | 71.4 /100 | #146 | Good 10.9% |
Demographics Similar to Immigrants from Senegal by Male Poverty
In terms of male poverty, the demographic groups most similar to Immigrants from Senegal are Immigrants from Caribbean (14.0%, a difference of 0.060%), Immigrants from Mexico (14.0%, a difference of 0.070%), Bahamian (14.1%, a difference of 0.10%), Immigrants from Guatemala (14.0%, a difference of 0.18%), and Senegalese (14.1%, a difference of 0.20%).
| Demographics | Rating | Rank | Male Poverty |
| Hispanics or Latinos | 0.0 /100 | #294 | Tragic 13.9% |
| Immigrants | Central America | 0.0 /100 | #295 | Tragic 13.9% |
| Cajuns | 0.0 /100 | #296 | Tragic 13.9% |
| Inupiat | 0.0 /100 | #297 | Tragic 14.0% |
| Blackfeet | 0.0 /100 | #298 | Tragic 14.0% |
| Immigrants | Guatemala | 0.0 /100 | #299 | Tragic 14.0% |
| Immigrants | Mexico | 0.0 /100 | #300 | Tragic 14.0% |
| Immigrants | Senegal | 0.0 /100 | #301 | Tragic 14.0% |
| Immigrants | Caribbean | 0.0 /100 | #302 | Tragic 14.0% |
| Bahamians | 0.0 /100 | #303 | Tragic 14.1% |
| Senegalese | 0.0 /100 | #304 | Tragic 14.1% |
| Immigrants | Bangladesh | 0.0 /100 | #305 | Tragic 14.1% |
| Creek | 0.0 /100 | #306 | Tragic 14.1% |
| Dutch West Indians | 0.0 /100 | #307 | Tragic 14.2% |
| Africans | 0.0 /100 | #308 | Tragic 14.2% |