Bhutanese vs Crow Male Poverty
COMPARE
Bhutanese
Crow
Male Poverty
Male Poverty Comparison
Bhutanese
Crow
9.5%
MALE POVERTY
99.8/ 100
METRIC RATING
15th/ 347
METRIC RANK
19.1%
MALE POVERTY
0.0/ 100
METRIC RATING
338th/ 347
METRIC RANK
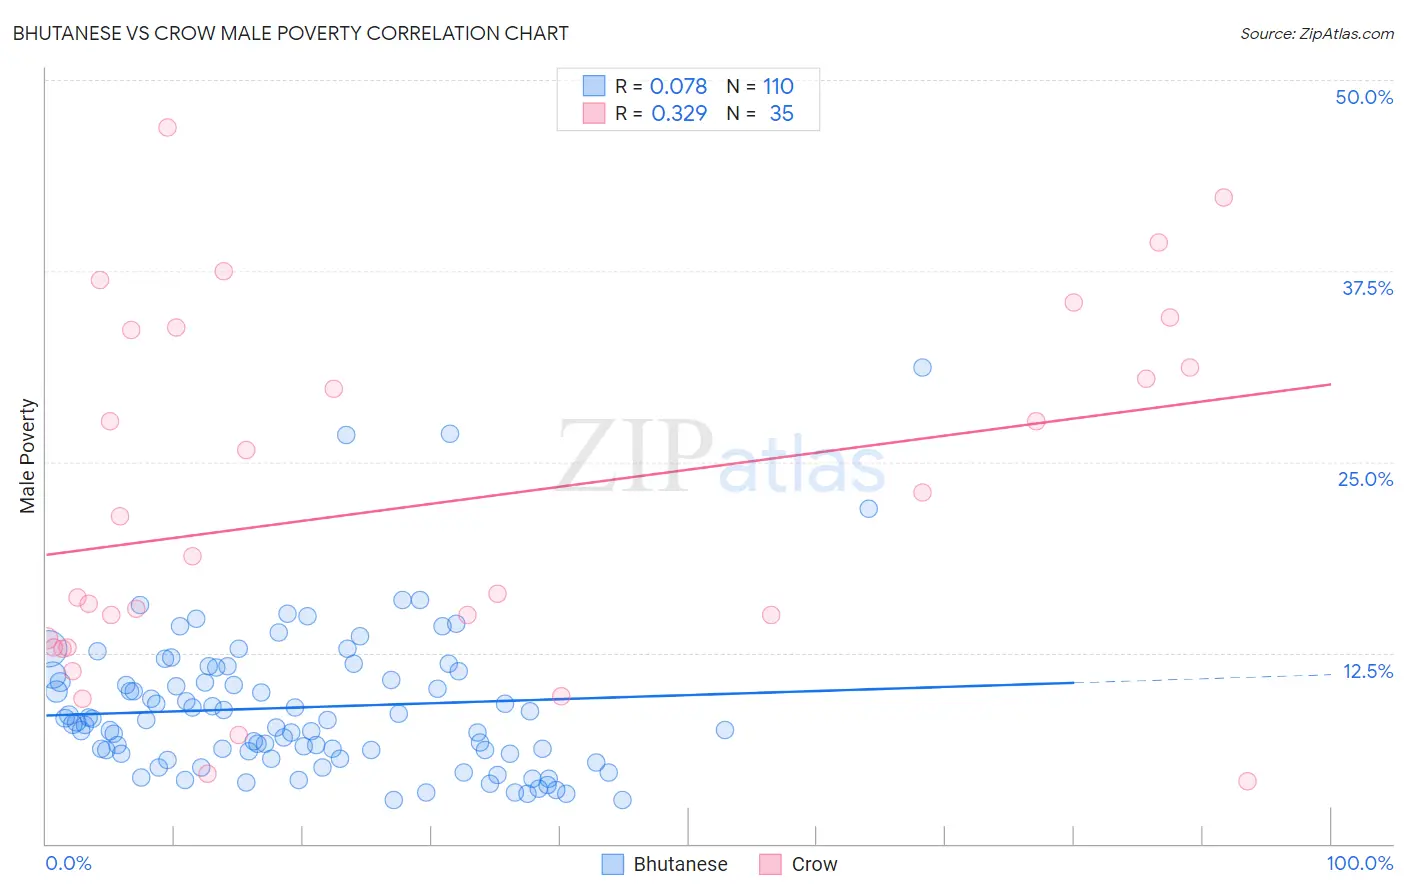
Bhutanese vs Crow Male Poverty Correlation Chart
The statistical analysis conducted on geographies consisting of 454,976,396 people shows a slight positive correlation between the proportion of Bhutanese and poverty level among males in the United States with a correlation coefficient (R) of 0.078 and weighted average of 9.5%. Similarly, the statistical analysis conducted on geographies consisting of 59,196,119 people shows a mild positive correlation between the proportion of Crow and poverty level among males in the United States with a correlation coefficient (R) of 0.329 and weighted average of 19.1%, a difference of 102.2%.
Male Poverty Correlation Summary
| Measurement | Bhutanese | Crow |
| Minimum | 2.8% | 4.1% |
| Maximum | 31.2% | 46.9% |
| Range | 28.3% | 42.8% |
| Mean | 8.9% | 22.4% |
| Median | 8.0% | 18.8% |
| Interquartile 25% (IQ1) | 5.9% | 12.8% |
| Interquartile 75% (IQ3) | 11.0% | 33.6% |
| Interquartile Range (IQR) | 5.1% | 20.8% |
| Standard Deviation (Sample) | 4.9% | 11.6% |
| Standard Deviation (Population) | 4.8% | 11.5% |
Similar Demographics by Male Poverty
Demographics Similar to Bhutanese by Male Poverty
In terms of male poverty, the demographic groups most similar to Bhutanese are Immigrants from North Macedonia (9.4%, a difference of 0.29%), Luxembourger (9.5%, a difference of 0.52%), Norwegian (9.5%, a difference of 0.65%), Immigrants from Lithuania (9.4%, a difference of 0.67%), and Immigrants from Bolivia (9.4%, a difference of 0.79%).
| Demographics | Rating | Rank | Male Poverty |
| Filipinos | 99.9 /100 | #8 | Exceptional 9.2% |
| Immigrants | South Central Asia | 99.9 /100 | #9 | Exceptional 9.3% |
| Bulgarians | 99.9 /100 | #10 | Exceptional 9.3% |
| Bolivians | 99.9 /100 | #11 | Exceptional 9.4% |
| Immigrants | Bolivia | 99.9 /100 | #12 | Exceptional 9.4% |
| Immigrants | Lithuania | 99.9 /100 | #13 | Exceptional 9.4% |
| Immigrants | North Macedonia | 99.8 /100 | #14 | Exceptional 9.4% |
| Bhutanese | 99.8 /100 | #15 | Exceptional 9.5% |
| Luxembourgers | 99.8 /100 | #16 | Exceptional 9.5% |
| Norwegians | 99.8 /100 | #17 | Exceptional 9.5% |
| Lithuanians | 99.8 /100 | #18 | Exceptional 9.5% |
| Immigrants | Hong Kong | 99.7 /100 | #19 | Exceptional 9.6% |
| Latvians | 99.7 /100 | #20 | Exceptional 9.6% |
| Immigrants | Scotland | 99.7 /100 | #21 | Exceptional 9.6% |
| Croatians | 99.7 /100 | #22 | Exceptional 9.6% |
Demographics Similar to Crow by Male Poverty
In terms of male poverty, the demographic groups most similar to Crow are Yuman (19.5%, a difference of 2.2%), Sioux (18.7%, a difference of 2.3%), Pueblo (18.5%, a difference of 3.4%), Immigrants from Yemen (20.1%, a difference of 5.3%), and Lumbee (20.2%, a difference of 5.6%).
| Demographics | Rating | Rank | Male Poverty |
| Ute | 0.0 /100 | #331 | Tragic 16.2% |
| Houma | 0.0 /100 | #332 | Tragic 16.7% |
| Natives/Alaskans | 0.0 /100 | #333 | Tragic 16.9% |
| Cheyenne | 0.0 /100 | #334 | Tragic 17.6% |
| Apache | 0.0 /100 | #335 | Tragic 17.7% |
| Pueblo | 0.0 /100 | #336 | Tragic 18.5% |
| Sioux | 0.0 /100 | #337 | Tragic 18.7% |
| Crow | 0.0 /100 | #338 | Tragic 19.1% |
| Yuman | 0.0 /100 | #339 | Tragic 19.5% |
| Immigrants | Yemen | 0.0 /100 | #340 | Tragic 20.1% |
| Lumbee | 0.0 /100 | #341 | Tragic 20.2% |
| Pima | 0.0 /100 | #342 | Tragic 20.4% |
| Yup'ik | 0.0 /100 | #343 | Tragic 20.4% |
| Hopi | 0.0 /100 | #344 | Tragic 20.8% |
| Puerto Ricans | 0.0 /100 | #345 | Tragic 22.0% |