Immigrants from Hong Kong vs Immigrants from El Salvador Bachelor's Degree
COMPARE
Immigrants from Hong Kong
Immigrants from El Salvador
Bachelor's Degree
Bachelor's Degree Comparison
Immigrants from Hong Kong
Immigrants from El Salvador
48.2%
BACHELOR'S DEGREE
100.0/ 100
METRIC RATING
14th/ 347
METRIC RANK
31.3%
BACHELOR'S DEGREE
0.1/ 100
METRIC RATING
286th/ 347
METRIC RANK
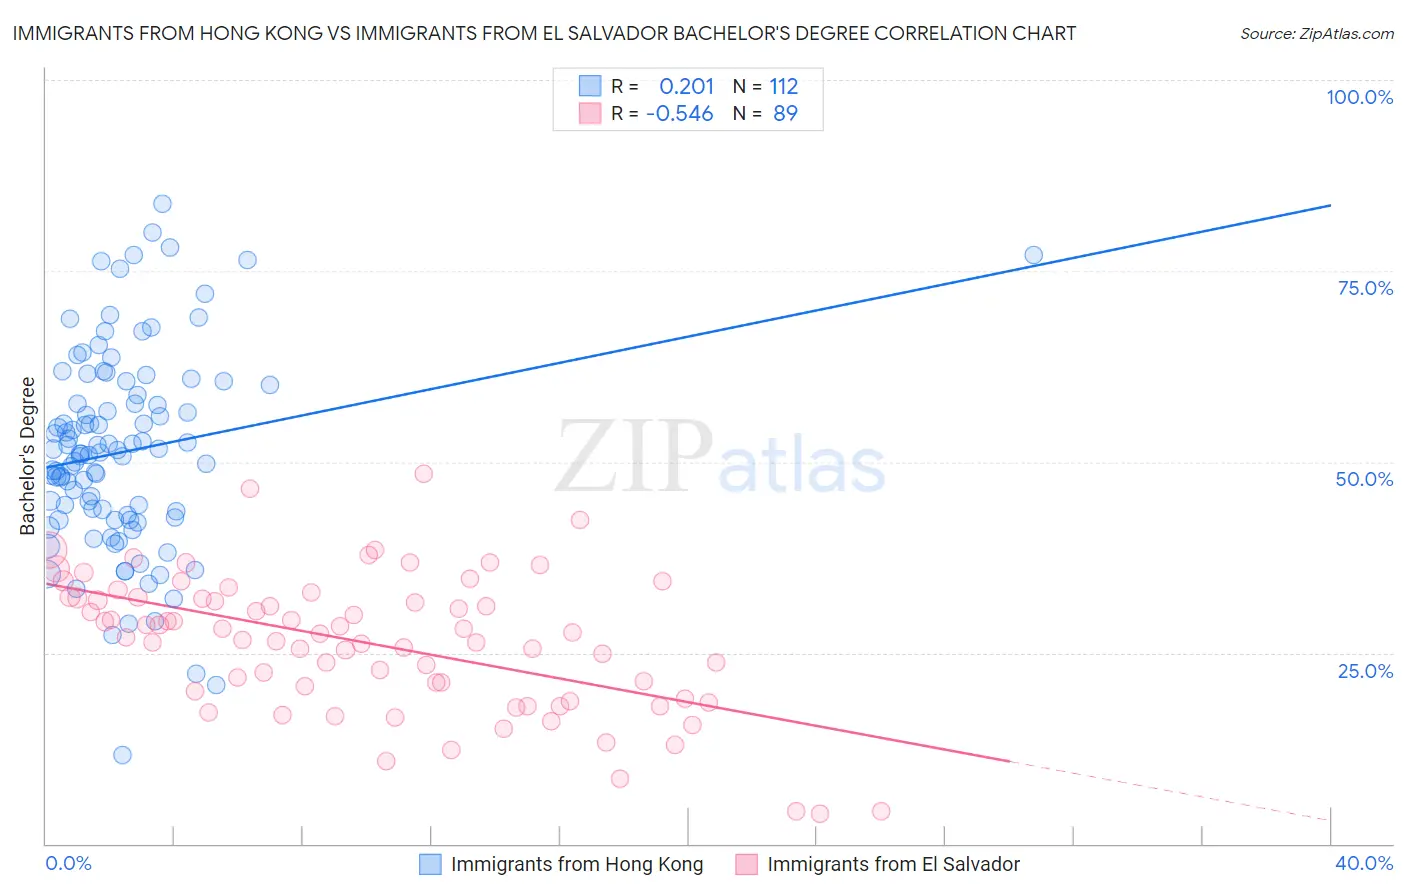
Immigrants from Hong Kong vs Immigrants from El Salvador Bachelor's Degree Correlation Chart
The statistical analysis conducted on geographies consisting of 253,986,152 people shows a weak positive correlation between the proportion of Immigrants from Hong Kong and percentage of population with at least bachelor's degree education in the United States with a correlation coefficient (R) of 0.201 and weighted average of 48.2%. Similarly, the statistical analysis conducted on geographies consisting of 357,832,054 people shows a substantial negative correlation between the proportion of Immigrants from El Salvador and percentage of population with at least bachelor's degree education in the United States with a correlation coefficient (R) of -0.546 and weighted average of 31.3%, a difference of 54.0%.
Bachelor's Degree Correlation Summary
| Measurement | Immigrants from Hong Kong | Immigrants from El Salvador |
| Minimum | 11.7% | 3.9% |
| Maximum | 83.9% | 48.5% |
| Range | 72.2% | 44.6% |
| Mean | 51.3% | 26.3% |
| Median | 51.2% | 27.5% |
| Interquartile 25% (IQ1) | 42.9% | 19.4% |
| Interquartile 75% (IQ3) | 59.4% | 32.2% |
| Interquartile Range (IQR) | 16.5% | 12.8% |
| Standard Deviation (Sample) | 13.2% | 9.0% |
| Standard Deviation (Population) | 13.1% | 8.9% |
Similar Demographics by Bachelor's Degree
Demographics Similar to Immigrants from Hong Kong by Bachelor's Degree
In terms of bachelor's degree, the demographic groups most similar to Immigrants from Hong Kong are Immigrants from Eastern Asia (48.1%, a difference of 0.14%), Immigrants from South Central Asia (48.3%, a difference of 0.28%), Immigrants from China (48.4%, a difference of 0.42%), Immigrants from Australia (48.5%, a difference of 0.60%), and Soviet Union (47.9%, a difference of 0.60%).
| Demographics | Rating | Rank | Bachelor's Degree |
| Immigrants | Iran | 100.0 /100 | #7 | Exceptional 50.3% |
| Thais | 100.0 /100 | #8 | Exceptional 50.1% |
| Immigrants | Israel | 100.0 /100 | #9 | Exceptional 50.0% |
| Cypriots | 100.0 /100 | #10 | Exceptional 49.0% |
| Immigrants | Australia | 100.0 /100 | #11 | Exceptional 48.5% |
| Immigrants | China | 100.0 /100 | #12 | Exceptional 48.4% |
| Immigrants | South Central Asia | 100.0 /100 | #13 | Exceptional 48.3% |
| Immigrants | Hong Kong | 100.0 /100 | #14 | Exceptional 48.2% |
| Immigrants | Eastern Asia | 100.0 /100 | #15 | Exceptional 48.1% |
| Soviet Union | 100.0 /100 | #16 | Exceptional 47.9% |
| Eastern Europeans | 100.0 /100 | #17 | Exceptional 47.5% |
| Indians (Asian) | 100.0 /100 | #18 | Exceptional 47.4% |
| Cambodians | 100.0 /100 | #19 | Exceptional 47.2% |
| Immigrants | Switzerland | 100.0 /100 | #20 | Exceptional 47.1% |
| Immigrants | Ireland | 100.0 /100 | #21 | Exceptional 47.1% |
Demographics Similar to Immigrants from El Salvador by Bachelor's Degree
In terms of bachelor's degree, the demographic groups most similar to Immigrants from El Salvador are Aleut (31.3%, a difference of 0.050%), Haitian (31.3%, a difference of 0.070%), Honduran (31.3%, a difference of 0.10%), Immigrants from Caribbean (31.4%, a difference of 0.38%), and Blackfeet (31.5%, a difference of 0.52%).
| Demographics | Rating | Rank | Bachelor's Degree |
| Hawaiians | 0.1 /100 | #279 | Tragic 31.6% |
| Immigrants | Laos | 0.1 /100 | #280 | Tragic 31.6% |
| Blackfeet | 0.1 /100 | #281 | Tragic 31.5% |
| Immigrants | Caribbean | 0.1 /100 | #282 | Tragic 31.4% |
| Hondurans | 0.1 /100 | #283 | Tragic 31.3% |
| Haitians | 0.1 /100 | #284 | Tragic 31.3% |
| Aleuts | 0.1 /100 | #285 | Tragic 31.3% |
| Immigrants | El Salvador | 0.1 /100 | #286 | Tragic 31.3% |
| Ottawa | 0.1 /100 | #287 | Tragic 31.1% |
| Guatemalans | 0.1 /100 | #288 | Tragic 31.0% |
| Puerto Ricans | 0.1 /100 | #289 | Tragic 31.0% |
| Immigrants | Honduras | 0.1 /100 | #290 | Tragic 30.9% |
| Blacks/African Americans | 0.1 /100 | #291 | Tragic 30.9% |
| Ute | 0.1 /100 | #292 | Tragic 30.9% |
| Cape Verdeans | 0.1 /100 | #293 | Tragic 30.9% |