Ottawa vs Immigrants from El Salvador Married-Couple Family Poverty
COMPARE
Ottawa
Immigrants from El Salvador
Married-Couple Family Poverty
Married-Couple Family Poverty Comparison
Ottawa
Immigrants from El Salvador
5.2%
MARRIED-COUPLE FAMILY POVERTY
54.5/ 100
METRIC RATING
169th/ 347
METRIC RANK
6.8%
MARRIED-COUPLE FAMILY POVERTY
0.0/ 100
METRIC RATING
303rd/ 347
METRIC RANK
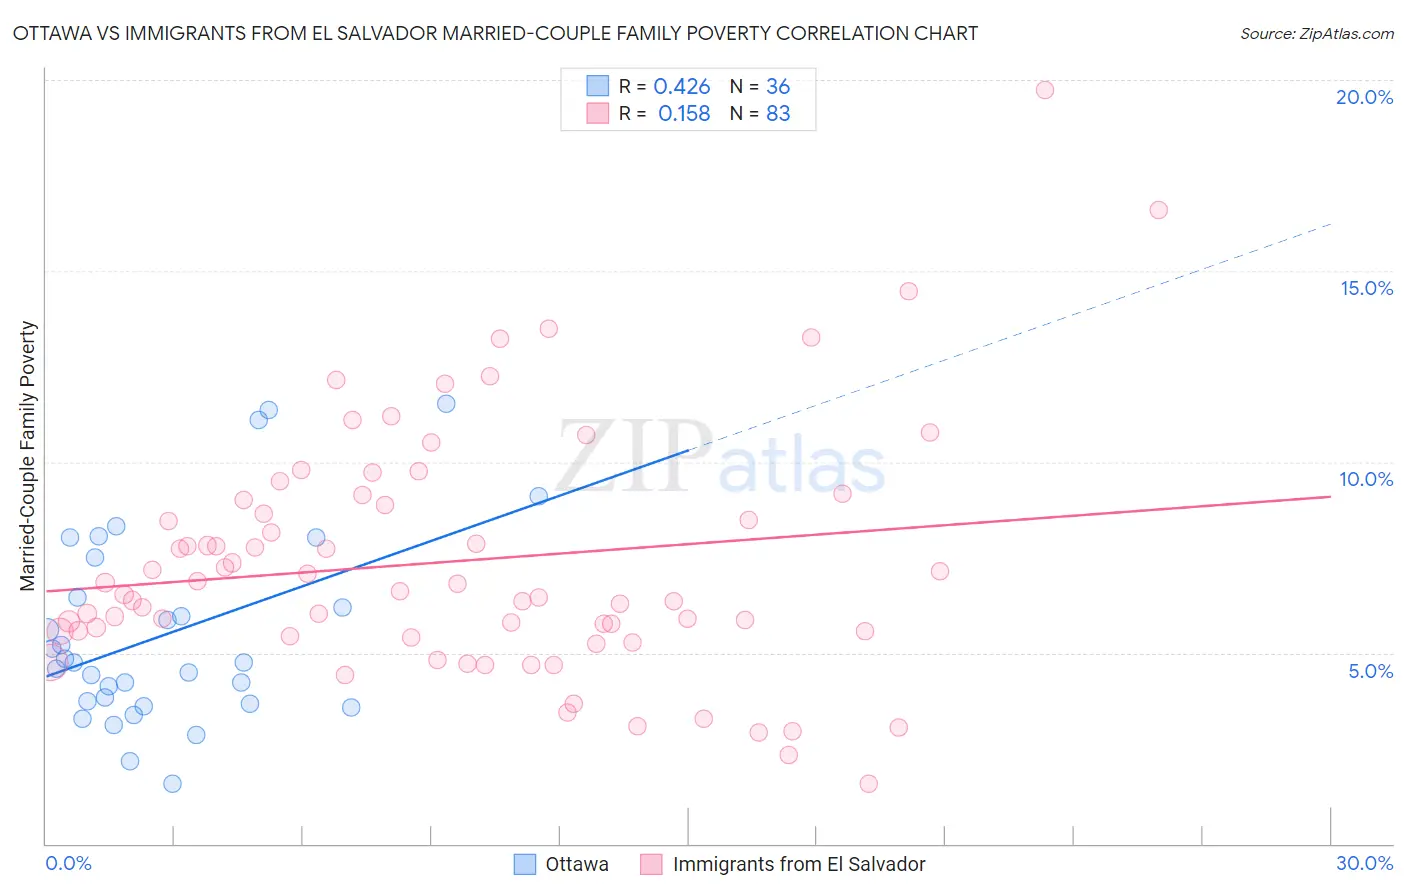
Ottawa vs Immigrants from El Salvador Married-Couple Family Poverty Correlation Chart
The statistical analysis conducted on geographies consisting of 49,836,436 people shows a moderate positive correlation between the proportion of Ottawa and poverty level among married-couple families in the United States with a correlation coefficient (R) of 0.426 and weighted average of 5.2%. Similarly, the statistical analysis conducted on geographies consisting of 355,612,998 people shows a poor positive correlation between the proportion of Immigrants from El Salvador and poverty level among married-couple families in the United States with a correlation coefficient (R) of 0.158 and weighted average of 6.8%, a difference of 30.4%.
Married-Couple Family Poverty Correlation Summary
| Measurement | Ottawa | Immigrants from El Salvador |
| Minimum | 1.6% | 1.6% |
| Maximum | 11.5% | 19.7% |
| Range | 10.0% | 18.2% |
| Mean | 5.5% | 7.4% |
| Median | 4.8% | 6.6% |
| Interquartile 25% (IQ1) | 3.7% | 5.6% |
| Interquartile 75% (IQ3) | 7.0% | 9.0% |
| Interquartile Range (IQR) | 3.3% | 3.4% |
| Standard Deviation (Sample) | 2.5% | 3.2% |
| Standard Deviation (Population) | 2.5% | 3.2% |
Similar Demographics by Married-Couple Family Poverty
Demographics Similar to Ottawa by Married-Couple Family Poverty
In terms of married-couple family poverty, the demographic groups most similar to Ottawa are Immigrants from Argentina (5.2%, a difference of 0.010%), Immigrants from Uganda (5.2%, a difference of 0.040%), Bermudan (5.2%, a difference of 0.19%), Immigrants from Northern Africa (5.2%, a difference of 0.37%), and Alsatian (5.2%, a difference of 0.39%).
| Demographics | Rating | Rank | Married-Couple Family Poverty |
| Immigrants | Jordan | 66.5 /100 | #162 | Good 5.1% |
| Sierra Leoneans | 64.1 /100 | #163 | Good 5.1% |
| Hawaiians | 62.3 /100 | #164 | Good 5.1% |
| Immigrants | Malaysia | 62.2 /100 | #165 | Good 5.1% |
| Paraguayans | 61.5 /100 | #166 | Good 5.1% |
| Costa Ricans | 61.5 /100 | #167 | Good 5.1% |
| Immigrants | Uganda | 54.9 /100 | #168 | Average 5.2% |
| Ottawa | 54.5 /100 | #169 | Average 5.2% |
| Immigrants | Argentina | 54.4 /100 | #170 | Average 5.2% |
| Bermudans | 52.9 /100 | #171 | Average 5.2% |
| Immigrants | Northern Africa | 51.3 /100 | #172 | Average 5.2% |
| Alsatians | 51.2 /100 | #173 | Average 5.2% |
| Immigrants | Eastern Africa | 50.0 /100 | #174 | Average 5.2% |
| Marshallese | 47.9 /100 | #175 | Average 5.2% |
| Menominee | 47.8 /100 | #176 | Average 5.2% |
Demographics Similar to Immigrants from El Salvador by Married-Couple Family Poverty
In terms of married-couple family poverty, the demographic groups most similar to Immigrants from El Salvador are Immigrants from Ecuador (6.7%, a difference of 0.28%), Central American (6.7%, a difference of 0.42%), Cuban (6.8%, a difference of 0.44%), Haitian (6.8%, a difference of 0.55%), and Immigrants from Belize (6.7%, a difference of 1.0%).
| Demographics | Rating | Rank | Married-Couple Family Poverty |
| U.S. Virgin Islanders | 0.0 /100 | #296 | Tragic 6.6% |
| Kiowa | 0.0 /100 | #297 | Tragic 6.6% |
| Immigrants | Guyana | 0.0 /100 | #298 | Tragic 6.7% |
| Nicaraguans | 0.0 /100 | #299 | Tragic 6.7% |
| Immigrants | Belize | 0.0 /100 | #300 | Tragic 6.7% |
| Central Americans | 0.0 /100 | #301 | Tragic 6.7% |
| Immigrants | Ecuador | 0.0 /100 | #302 | Tragic 6.7% |
| Immigrants | El Salvador | 0.0 /100 | #303 | Tragic 6.8% |
| Cubans | 0.0 /100 | #304 | Tragic 6.8% |
| Haitians | 0.0 /100 | #305 | Tragic 6.8% |
| Immigrants | Haiti | 0.0 /100 | #306 | Tragic 7.0% |
| Guatemalans | 0.0 /100 | #307 | Tragic 7.0% |
| Spanish American Indians | 0.0 /100 | #308 | Tragic 7.1% |
| Hopi | 0.0 /100 | #309 | Tragic 7.1% |
| Immigrants | Nicaragua | 0.0 /100 | #310 | Tragic 7.1% |