Immigrants from Hong Kong vs Immigrants from El Salvador Unemployment Among Seniors over 65 years
COMPARE
Immigrants from Hong Kong
Immigrants from El Salvador
Unemployment Among Seniors over 65 years
Unemployment Among Seniors over 65 years Comparison
Immigrants from Hong Kong
Immigrants from El Salvador
5.1%
UNEMPLOYMENT AMONG SENIORS OVER 65 YEARS
74.0/ 100
METRIC RATING
154th/ 347
METRIC RANK
5.7%
UNEMPLOYMENT AMONG SENIORS OVER 65 YEARS
0.0/ 100
METRIC RATING
315th/ 347
METRIC RANK
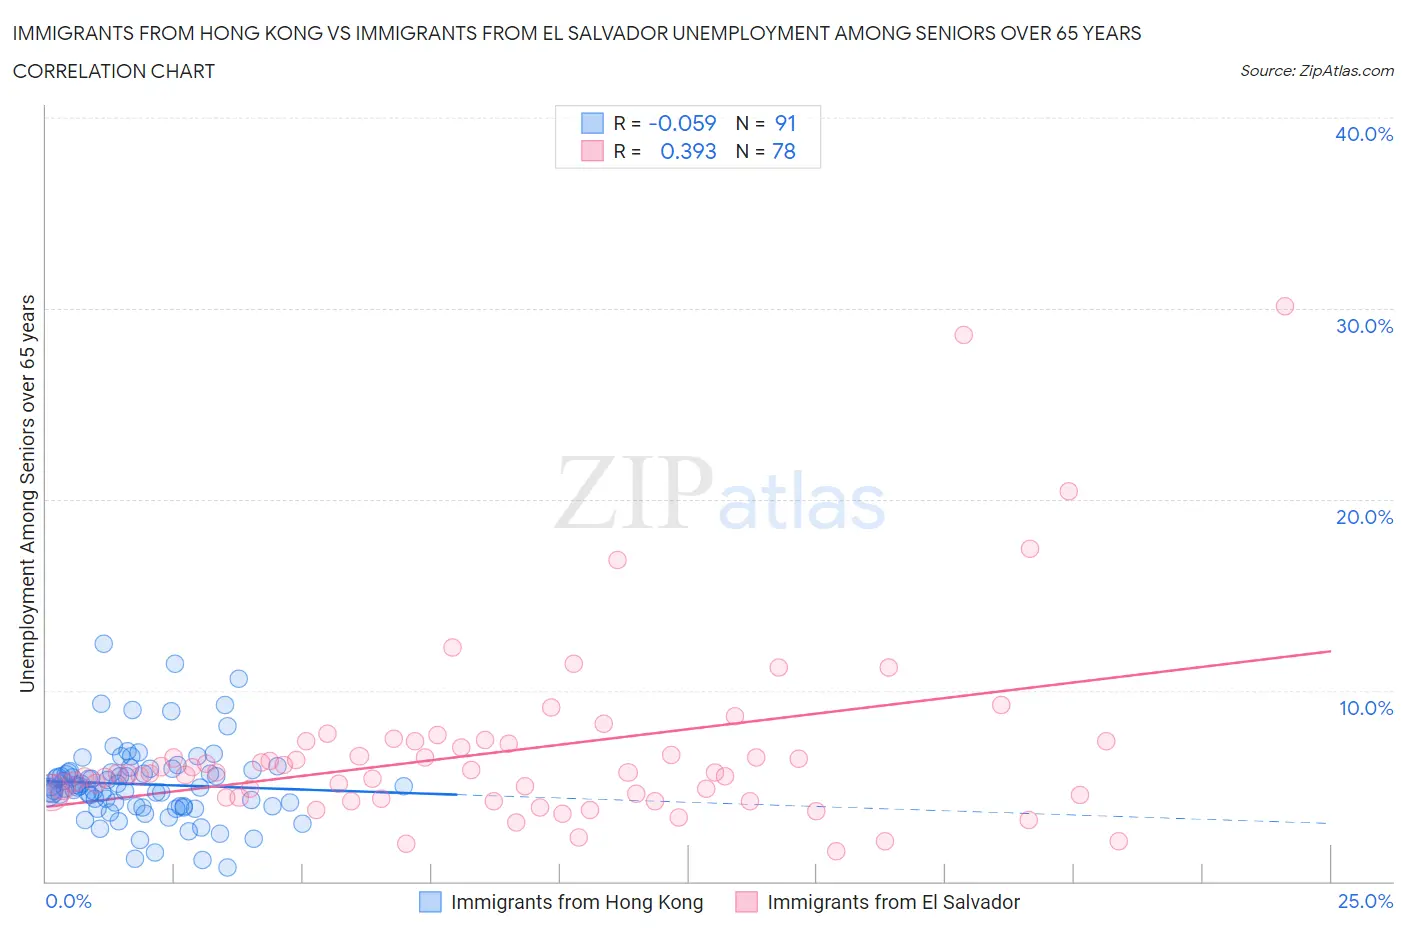
Immigrants from Hong Kong vs Immigrants from El Salvador Unemployment Among Seniors over 65 years Correlation Chart
The statistical analysis conducted on geographies consisting of 240,369,509 people shows a slight negative correlation between the proportion of Immigrants from Hong Kong and unemployment rate amomg seniors over the age of 65 in the United States with a correlation coefficient (R) of -0.059 and weighted average of 5.1%. Similarly, the statistical analysis conducted on geographies consisting of 325,889,231 people shows a mild positive correlation between the proportion of Immigrants from El Salvador and unemployment rate amomg seniors over the age of 65 in the United States with a correlation coefficient (R) of 0.393 and weighted average of 5.7%, a difference of 11.1%.
Unemployment Among Seniors over 65 years Correlation Summary
| Measurement | Immigrants from Hong Kong | Immigrants from El Salvador |
| Minimum | 0.70% | 1.6% |
| Maximum | 12.5% | 30.1% |
| Range | 11.8% | 28.5% |
| Mean | 5.1% | 6.8% |
| Median | 4.9% | 5.7% |
| Interquartile 25% (IQ1) | 3.9% | 4.4% |
| Interquartile 75% (IQ3) | 5.8% | 7.3% |
| Interquartile Range (IQR) | 1.9% | 2.9% |
| Standard Deviation (Sample) | 2.0% | 4.9% |
| Standard Deviation (Population) | 2.0% | 4.8% |
Similar Demographics by Unemployment Among Seniors over 65 years
Demographics Similar to Immigrants from Hong Kong by Unemployment Among Seniors over 65 years
In terms of unemployment among seniors over 65 years, the demographic groups most similar to Immigrants from Hong Kong are Immigrants from Czechoslovakia (5.1%, a difference of 0.020%), Canadian (5.1%, a difference of 0.030%), Basque (5.1%, a difference of 0.050%), Pakistani (5.1%, a difference of 0.060%), and Immigrants from Asia (5.1%, a difference of 0.070%).
| Demographics | Rating | Rank | Unemployment Among Seniors over 65 years |
| Slovaks | 77.9 /100 | #147 | Good 5.1% |
| Greeks | 77.0 /100 | #148 | Good 5.1% |
| Immigrants | Afghanistan | 76.8 /100 | #149 | Good 5.1% |
| Immigrants | Asia | 75.6 /100 | #150 | Good 5.1% |
| Pakistanis | 75.5 /100 | #151 | Good 5.1% |
| Canadians | 74.7 /100 | #152 | Good 5.1% |
| Immigrants | Czechoslovakia | 74.5 /100 | #153 | Good 5.1% |
| Immigrants | Hong Kong | 74.0 /100 | #154 | Good 5.1% |
| Basques | 72.9 /100 | #155 | Good 5.1% |
| Immigrants | Romania | 72.4 /100 | #156 | Good 5.1% |
| Immigrants | Northern Europe | 69.8 /100 | #157 | Good 5.1% |
| Immigrants | Belarus | 69.0 /100 | #158 | Good 5.1% |
| Immigrants | France | 68.6 /100 | #159 | Good 5.1% |
| French | 68.1 /100 | #160 | Good 5.1% |
| Immigrants | Bosnia and Herzegovina | 66.1 /100 | #161 | Good 5.1% |
Demographics Similar to Immigrants from El Salvador by Unemployment Among Seniors over 65 years
In terms of unemployment among seniors over 65 years, the demographic groups most similar to Immigrants from El Salvador are Delaware (5.7%, a difference of 0.030%), Immigrants from Central America (5.7%, a difference of 0.18%), Immigrants from Bahamas (5.7%, a difference of 0.30%), Barbadian (5.6%, a difference of 0.55%), and Immigrants from Ecuador (5.6%, a difference of 0.58%).
| Demographics | Rating | Rank | Unemployment Among Seniors over 65 years |
| Immigrants | St. Vincent and the Grenadines | 0.0 /100 | #308 | Tragic 5.6% |
| Immigrants | Guatemala | 0.0 /100 | #309 | Tragic 5.6% |
| Salvadorans | 0.0 /100 | #310 | Tragic 5.6% |
| Immigrants | Guyana | 0.0 /100 | #311 | Tragic 5.6% |
| Immigrants | Ecuador | 0.0 /100 | #312 | Tragic 5.6% |
| Barbadians | 0.0 /100 | #313 | Tragic 5.6% |
| Delaware | 0.0 /100 | #314 | Tragic 5.7% |
| Immigrants | El Salvador | 0.0 /100 | #315 | Tragic 5.7% |
| Immigrants | Central America | 0.0 /100 | #316 | Tragic 5.7% |
| Immigrants | Bahamas | 0.0 /100 | #317 | Tragic 5.7% |
| Vietnamese | 0.0 /100 | #318 | Tragic 5.7% |
| Immigrants | Bangladesh | 0.0 /100 | #319 | Tragic 5.7% |
| Immigrants | Mexico | 0.0 /100 | #320 | Tragic 5.7% |
| British West Indians | 0.0 /100 | #321 | Tragic 5.8% |
| Natives/Alaskans | 0.0 /100 | #322 | Tragic 5.8% |