Immigrants from Honduras vs Menominee Married-Couple Family Poverty
COMPARE
Immigrants from Honduras
Menominee
Married-Couple Family Poverty
Married-Couple Family Poverty Comparison
Immigrants from Honduras
Menominee
7.3%
MARRIED-COUPLE FAMILY POVERTY
0.0/ 100
METRIC RATING
322nd/ 347
METRIC RANK
5.2%
MARRIED-COUPLE FAMILY POVERTY
47.8/ 100
METRIC RATING
176th/ 347
METRIC RANK
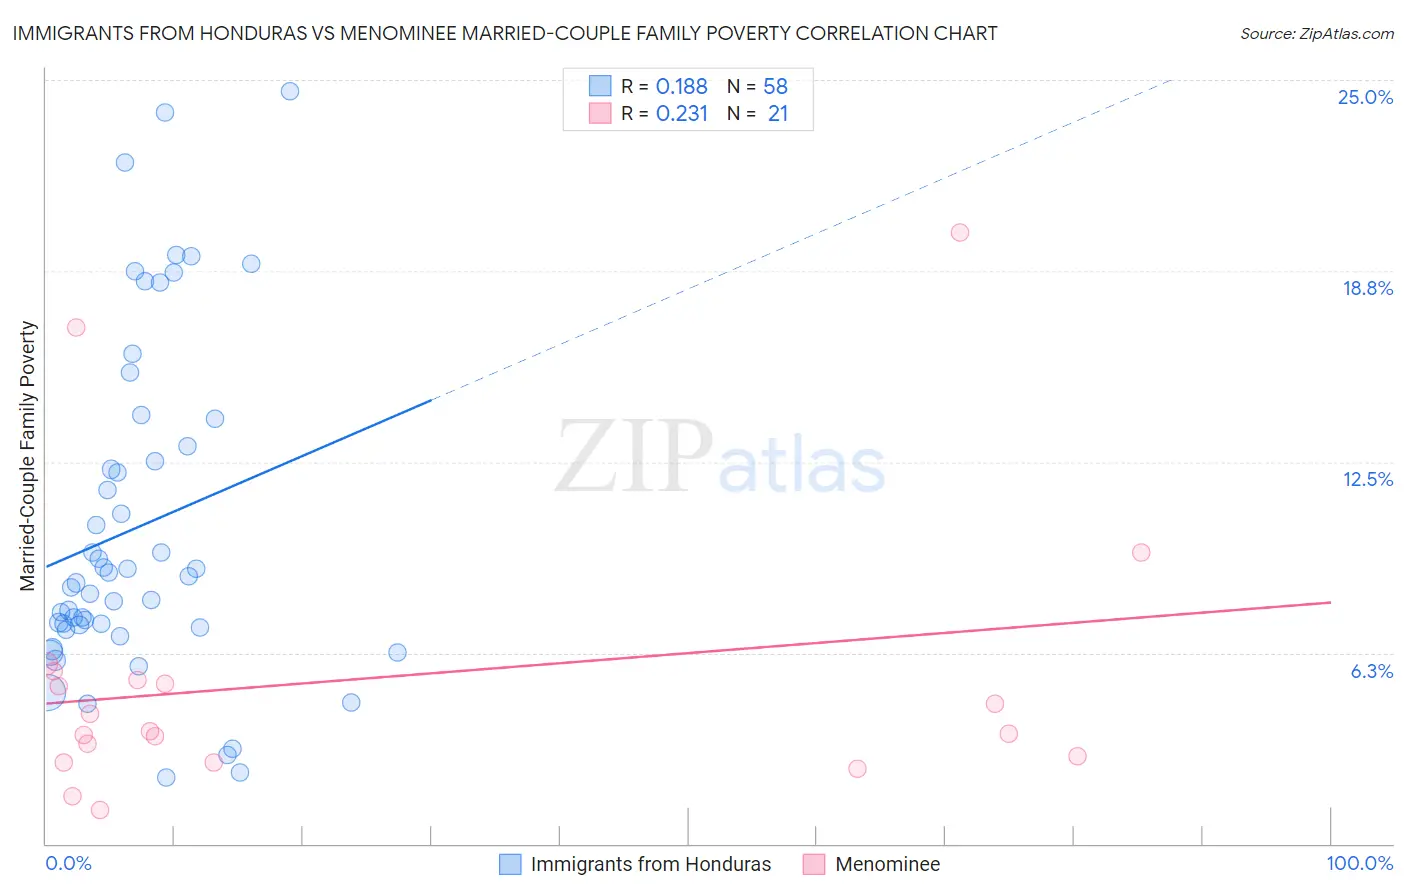
Immigrants from Honduras vs Menominee Married-Couple Family Poverty Correlation Chart
The statistical analysis conducted on geographies consisting of 321,084,315 people shows a poor positive correlation between the proportion of Immigrants from Honduras and poverty level among married-couple families in the United States with a correlation coefficient (R) of 0.188 and weighted average of 7.3%. Similarly, the statistical analysis conducted on geographies consisting of 45,721,986 people shows a weak positive correlation between the proportion of Menominee and poverty level among married-couple families in the United States with a correlation coefficient (R) of 0.231 and weighted average of 5.2%, a difference of 40.4%.
Married-Couple Family Poverty Correlation Summary
| Measurement | Immigrants from Honduras | Menominee |
| Minimum | 2.2% | 1.1% |
| Maximum | 24.6% | 20.0% |
| Range | 22.4% | 18.9% |
| Mean | 10.4% | 5.4% |
| Median | 8.6% | 3.7% |
| Interquartile 25% (IQ1) | 7.1% | 2.8% |
| Interquartile 75% (IQ3) | 13.0% | 5.5% |
| Interquartile Range (IQR) | 5.9% | 2.7% |
| Standard Deviation (Sample) | 5.5% | 4.7% |
| Standard Deviation (Population) | 5.4% | 4.6% |
Similar Demographics by Married-Couple Family Poverty
Demographics Similar to Immigrants from Honduras by Married-Couple Family Poverty
In terms of married-couple family poverty, the demographic groups most similar to Immigrants from Honduras are Immigrants from Caribbean (7.3%, a difference of 0.030%), Immigrants from Grenada (7.3%, a difference of 0.79%), Vietnamese (7.4%, a difference of 1.1%), Immigrants from Central America (7.4%, a difference of 1.1%), and Immigrants from Cuba (7.5%, a difference of 1.7%).
| Demographics | Rating | Rank | Married-Couple Family Poverty |
| Inupiat | 0.0 /100 | #315 | Tragic 7.1% |
| Hondurans | 0.0 /100 | #316 | Tragic 7.2% |
| Mexicans | 0.0 /100 | #317 | Tragic 7.2% |
| Immigrants | Guatemala | 0.0 /100 | #318 | Tragic 7.2% |
| Immigrants | Latin America | 0.0 /100 | #319 | Tragic 7.2% |
| Immigrants | Grenada | 0.0 /100 | #320 | Tragic 7.3% |
| Immigrants | Caribbean | 0.0 /100 | #321 | Tragic 7.3% |
| Immigrants | Honduras | 0.0 /100 | #322 | Tragic 7.3% |
| Vietnamese | 0.0 /100 | #323 | Tragic 7.4% |
| Immigrants | Central America | 0.0 /100 | #324 | Tragic 7.4% |
| Immigrants | Cuba | 0.0 /100 | #325 | Tragic 7.5% |
| Immigrants | Bangladesh | 0.0 /100 | #326 | Tragic 7.5% |
| Hispanics or Latinos | 0.0 /100 | #327 | Tragic 7.5% |
| Immigrants | Mexico | 0.0 /100 | #328 | Tragic 7.6% |
| Natives/Alaskans | 0.0 /100 | #329 | Tragic 8.2% |
Demographics Similar to Menominee by Married-Couple Family Poverty
In terms of married-couple family poverty, the demographic groups most similar to Menominee are Marshallese (5.2%, a difference of 0.010%), Immigrants from Eastern Africa (5.2%, a difference of 0.25%), Immigrants from Kazakhstan (5.2%, a difference of 0.32%), Immigrants from Ukraine (5.2%, a difference of 0.34%), and Alsatian (5.2%, a difference of 0.39%).
| Demographics | Rating | Rank | Married-Couple Family Poverty |
| Ottawa | 54.5 /100 | #169 | Average 5.2% |
| Immigrants | Argentina | 54.4 /100 | #170 | Average 5.2% |
| Bermudans | 52.9 /100 | #171 | Average 5.2% |
| Immigrants | Northern Africa | 51.3 /100 | #172 | Average 5.2% |
| Alsatians | 51.2 /100 | #173 | Average 5.2% |
| Immigrants | Eastern Africa | 50.0 /100 | #174 | Average 5.2% |
| Marshallese | 47.9 /100 | #175 | Average 5.2% |
| Menominee | 47.8 /100 | #176 | Average 5.2% |
| Immigrants | Kazakhstan | 45.1 /100 | #177 | Average 5.2% |
| Immigrants | Ukraine | 44.9 /100 | #178 | Average 5.2% |
| Spanish | 41.4 /100 | #179 | Average 5.3% |
| Immigrants | Sierra Leone | 39.3 /100 | #180 | Fair 5.3% |
| Immigrants | Chile | 38.8 /100 | #181 | Fair 5.3% |
| Immigrants | Vietnam | 37.7 /100 | #182 | Fair 5.3% |
| Peruvians | 37.6 /100 | #183 | Fair 5.3% |