Immigrants from Honduras vs Immigrants from Bolivia Married-Couple Family Poverty
COMPARE
Immigrants from Honduras
Immigrants from Bolivia
Married-Couple Family Poverty
Married-Couple Family Poverty Comparison
Immigrants from Honduras
Immigrants from Bolivia
7.3%
MARRIED-COUPLE FAMILY POVERTY
0.0/ 100
METRIC RATING
322nd/ 347
METRIC RANK
4.7%
MARRIED-COUPLE FAMILY POVERTY
96.2/ 100
METRIC RATING
110th/ 347
METRIC RANK
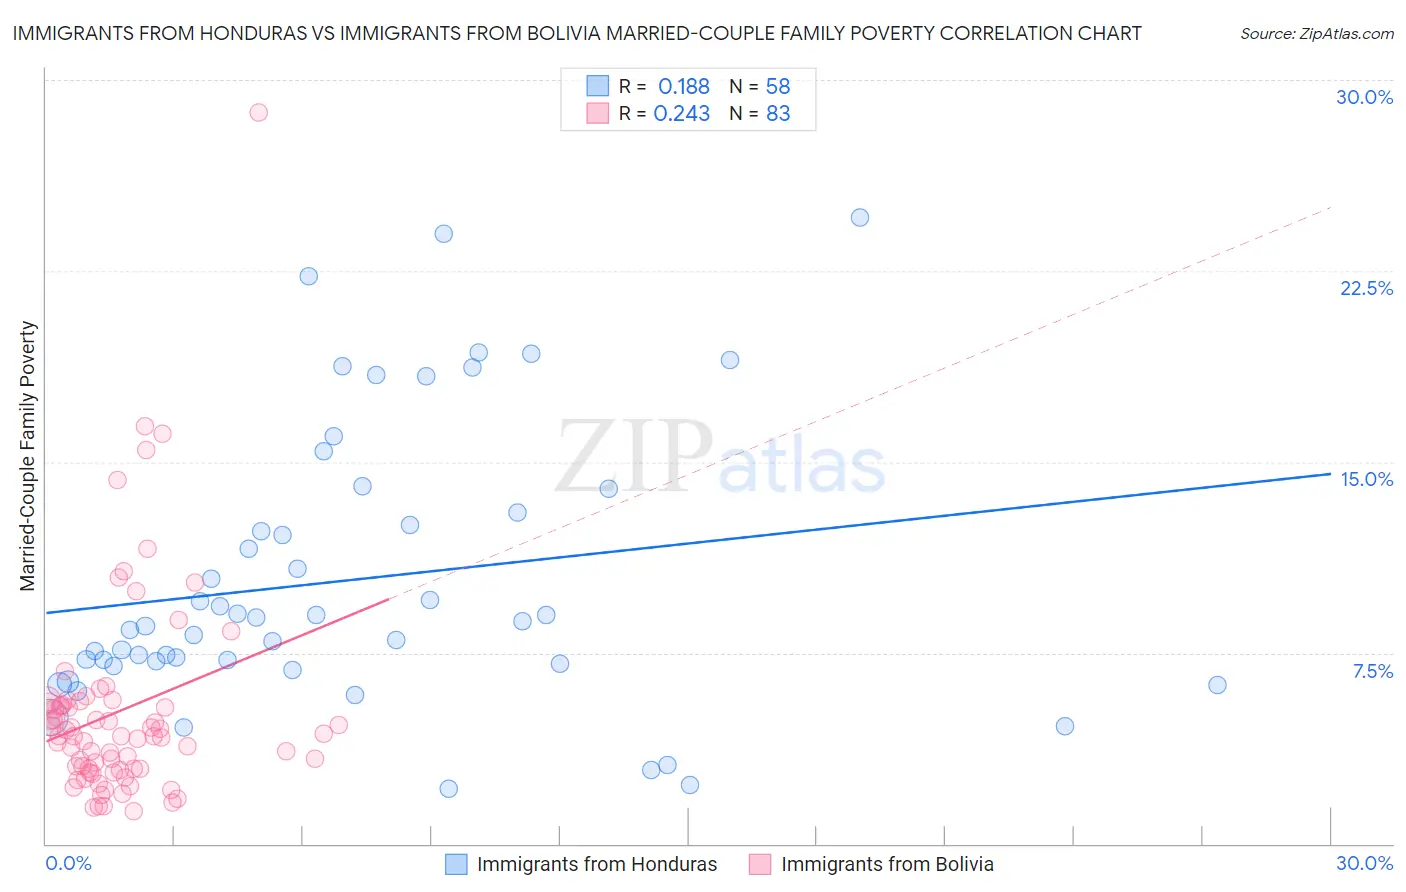
Immigrants from Honduras vs Immigrants from Bolivia Married-Couple Family Poverty Correlation Chart
The statistical analysis conducted on geographies consisting of 321,084,315 people shows a poor positive correlation between the proportion of Immigrants from Honduras and poverty level among married-couple families in the United States with a correlation coefficient (R) of 0.188 and weighted average of 7.3%. Similarly, the statistical analysis conducted on geographies consisting of 158,190,450 people shows a weak positive correlation between the proportion of Immigrants from Bolivia and poverty level among married-couple families in the United States with a correlation coefficient (R) of 0.243 and weighted average of 4.7%, a difference of 55.4%.
Married-Couple Family Poverty Correlation Summary
| Measurement | Immigrants from Honduras | Immigrants from Bolivia |
| Minimum | 2.2% | 1.3% |
| Maximum | 24.6% | 28.7% |
| Range | 22.4% | 27.5% |
| Mean | 10.4% | 5.2% |
| Median | 8.6% | 4.2% |
| Interquartile 25% (IQ1) | 7.1% | 2.9% |
| Interquartile 75% (IQ3) | 13.0% | 5.5% |
| Interquartile Range (IQR) | 5.9% | 2.6% |
| Standard Deviation (Sample) | 5.5% | 4.2% |
| Standard Deviation (Population) | 5.4% | 4.1% |
Similar Demographics by Married-Couple Family Poverty
Demographics Similar to Immigrants from Honduras by Married-Couple Family Poverty
In terms of married-couple family poverty, the demographic groups most similar to Immigrants from Honduras are Immigrants from Caribbean (7.3%, a difference of 0.030%), Immigrants from Grenada (7.3%, a difference of 0.79%), Vietnamese (7.4%, a difference of 1.1%), Immigrants from Central America (7.4%, a difference of 1.1%), and Immigrants from Cuba (7.5%, a difference of 1.7%).
| Demographics | Rating | Rank | Married-Couple Family Poverty |
| Inupiat | 0.0 /100 | #315 | Tragic 7.1% |
| Hondurans | 0.0 /100 | #316 | Tragic 7.2% |
| Mexicans | 0.0 /100 | #317 | Tragic 7.2% |
| Immigrants | Guatemala | 0.0 /100 | #318 | Tragic 7.2% |
| Immigrants | Latin America | 0.0 /100 | #319 | Tragic 7.2% |
| Immigrants | Grenada | 0.0 /100 | #320 | Tragic 7.3% |
| Immigrants | Caribbean | 0.0 /100 | #321 | Tragic 7.3% |
| Immigrants | Honduras | 0.0 /100 | #322 | Tragic 7.3% |
| Vietnamese | 0.0 /100 | #323 | Tragic 7.4% |
| Immigrants | Central America | 0.0 /100 | #324 | Tragic 7.4% |
| Immigrants | Cuba | 0.0 /100 | #325 | Tragic 7.5% |
| Immigrants | Bangladesh | 0.0 /100 | #326 | Tragic 7.5% |
| Hispanics or Latinos | 0.0 /100 | #327 | Tragic 7.5% |
| Immigrants | Mexico | 0.0 /100 | #328 | Tragic 7.6% |
| Natives/Alaskans | 0.0 /100 | #329 | Tragic 8.2% |
Demographics Similar to Immigrants from Bolivia by Married-Couple Family Poverty
In terms of married-couple family poverty, the demographic groups most similar to Immigrants from Bolivia are Pakistani (4.7%, a difference of 0.040%), Immigrants from Hong Kong (4.7%, a difference of 0.16%), Tongan (4.7%, a difference of 0.22%), Immigrants from Nepal (4.7%, a difference of 0.29%), and Laotian (4.7%, a difference of 0.36%).
| Demographics | Rating | Rank | Married-Couple Family Poverty |
| Immigrants | Romania | 97.3 /100 | #103 | Exceptional 4.7% |
| Immigrants | Moldova | 97.1 /100 | #104 | Exceptional 4.7% |
| Aleuts | 97.0 /100 | #105 | Exceptional 4.7% |
| Immigrants | France | 96.9 /100 | #106 | Exceptional 4.7% |
| Immigrants | Germany | 96.8 /100 | #107 | Exceptional 4.7% |
| Laotians | 96.6 /100 | #108 | Exceptional 4.7% |
| Immigrants | Hong Kong | 96.4 /100 | #109 | Exceptional 4.7% |
| Immigrants | Bolivia | 96.2 /100 | #110 | Exceptional 4.7% |
| Pakistanis | 96.2 /100 | #111 | Exceptional 4.7% |
| Tongans | 95.9 /100 | #112 | Exceptional 4.7% |
| Immigrants | Nepal | 95.9 /100 | #113 | Exceptional 4.7% |
| Immigrants | Indonesia | 95.1 /100 | #114 | Exceptional 4.8% |
| Taiwanese | 94.8 /100 | #115 | Exceptional 4.8% |
| Celtics | 94.8 /100 | #116 | Exceptional 4.8% |
| Kenyans | 94.7 /100 | #117 | Exceptional 4.8% |