Immigrants from Honduras vs Immigrants from Cambodia Married-Couple Family Poverty
COMPARE
Immigrants from Honduras
Immigrants from Cambodia
Married-Couple Family Poverty
Married-Couple Family Poverty Comparison
Immigrants from Honduras
Immigrants from Cambodia
7.3%
MARRIED-COUPLE FAMILY POVERTY
0.0/ 100
METRIC RATING
322nd/ 347
METRIC RANK
5.6%
MARRIED-COUPLE FAMILY POVERTY
6.1/ 100
METRIC RATING
225th/ 347
METRIC RANK
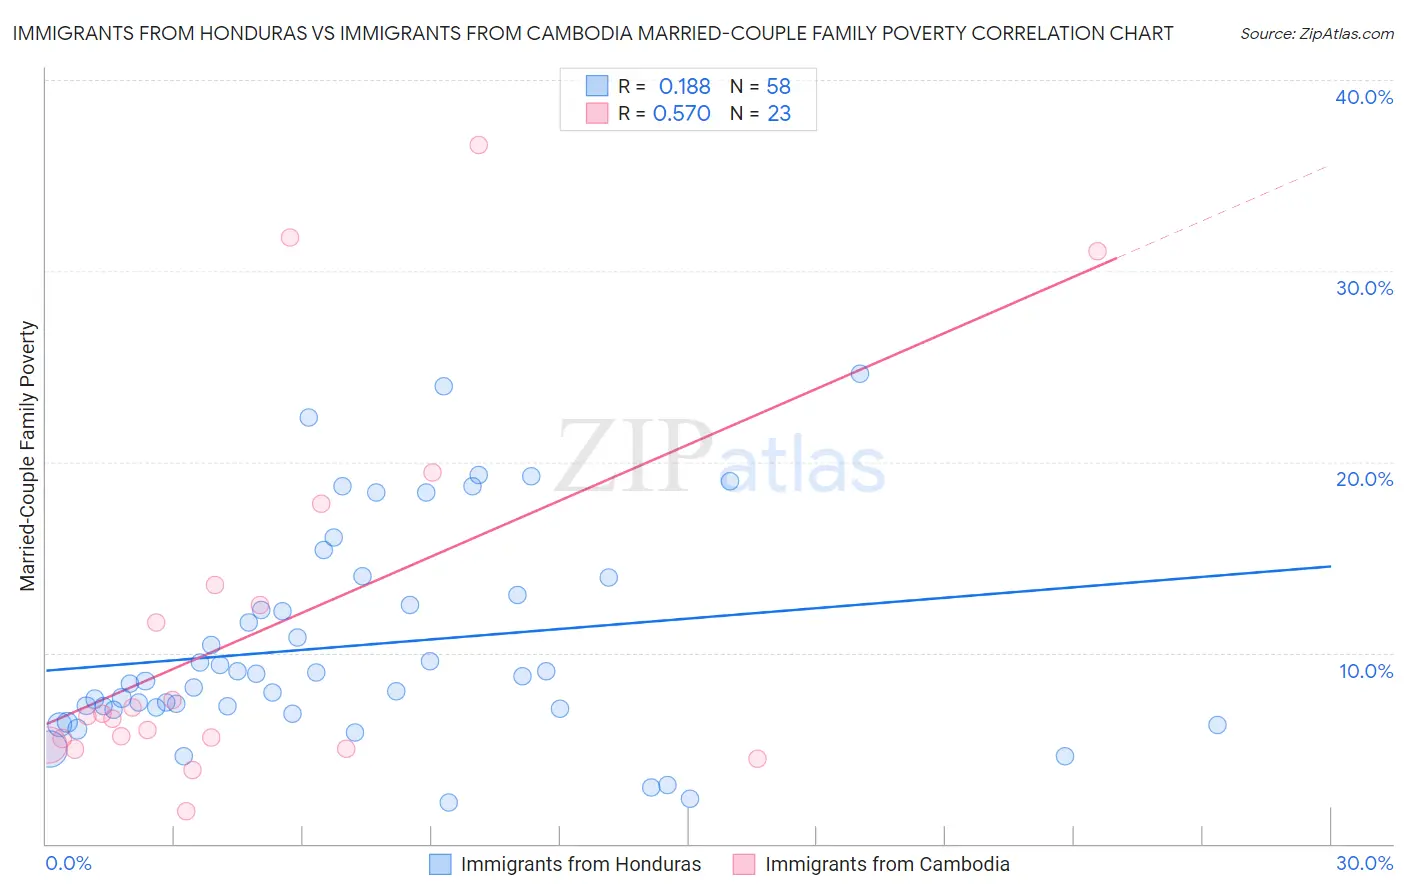
Immigrants from Honduras vs Immigrants from Cambodia Married-Couple Family Poverty Correlation Chart
The statistical analysis conducted on geographies consisting of 321,084,315 people shows a poor positive correlation between the proportion of Immigrants from Honduras and poverty level among married-couple families in the United States with a correlation coefficient (R) of 0.188 and weighted average of 7.3%. Similarly, the statistical analysis conducted on geographies consisting of 204,385,428 people shows a substantial positive correlation between the proportion of Immigrants from Cambodia and poverty level among married-couple families in the United States with a correlation coefficient (R) of 0.570 and weighted average of 5.6%, a difference of 30.4%.
Married-Couple Family Poverty Correlation Summary
| Measurement | Immigrants from Honduras | Immigrants from Cambodia |
| Minimum | 2.2% | 1.7% |
| Maximum | 24.6% | 36.6% |
| Range | 22.4% | 34.9% |
| Mean | 10.4% | 11.2% |
| Median | 8.6% | 6.7% |
| Interquartile 25% (IQ1) | 7.1% | 5.2% |
| Interquartile 75% (IQ3) | 13.0% | 13.6% |
| Interquartile Range (IQR) | 5.9% | 8.4% |
| Standard Deviation (Sample) | 5.5% | 9.8% |
| Standard Deviation (Population) | 5.4% | 9.6% |
Similar Demographics by Married-Couple Family Poverty
Demographics Similar to Immigrants from Honduras by Married-Couple Family Poverty
In terms of married-couple family poverty, the demographic groups most similar to Immigrants from Honduras are Immigrants from Caribbean (7.3%, a difference of 0.030%), Immigrants from Grenada (7.3%, a difference of 0.79%), Vietnamese (7.4%, a difference of 1.1%), Immigrants from Central America (7.4%, a difference of 1.1%), and Immigrants from Cuba (7.5%, a difference of 1.7%).
| Demographics | Rating | Rank | Married-Couple Family Poverty |
| Inupiat | 0.0 /100 | #315 | Tragic 7.1% |
| Hondurans | 0.0 /100 | #316 | Tragic 7.2% |
| Mexicans | 0.0 /100 | #317 | Tragic 7.2% |
| Immigrants | Guatemala | 0.0 /100 | #318 | Tragic 7.2% |
| Immigrants | Latin America | 0.0 /100 | #319 | Tragic 7.2% |
| Immigrants | Grenada | 0.0 /100 | #320 | Tragic 7.3% |
| Immigrants | Caribbean | 0.0 /100 | #321 | Tragic 7.3% |
| Immigrants | Honduras | 0.0 /100 | #322 | Tragic 7.3% |
| Vietnamese | 0.0 /100 | #323 | Tragic 7.4% |
| Immigrants | Central America | 0.0 /100 | #324 | Tragic 7.4% |
| Immigrants | Cuba | 0.0 /100 | #325 | Tragic 7.5% |
| Immigrants | Bangladesh | 0.0 /100 | #326 | Tragic 7.5% |
| Hispanics or Latinos | 0.0 /100 | #327 | Tragic 7.5% |
| Immigrants | Mexico | 0.0 /100 | #328 | Tragic 7.6% |
| Natives/Alaskans | 0.0 /100 | #329 | Tragic 8.2% |
Demographics Similar to Immigrants from Cambodia by Married-Couple Family Poverty
In terms of married-couple family poverty, the demographic groups most similar to Immigrants from Cambodia are Sudanese (5.6%, a difference of 0.14%), South American (5.6%, a difference of 0.22%), Immigrants from Zaire (5.6%, a difference of 0.24%), Immigrants from Fiji (5.6%, a difference of 0.25%), and Cajun (5.6%, a difference of 0.32%).
| Demographics | Rating | Rank | Married-Couple Family Poverty |
| Afghans | 11.2 /100 | #218 | Poor 5.5% |
| Japanese | 9.8 /100 | #219 | Tragic 5.6% |
| Colombians | 9.2 /100 | #220 | Tragic 5.6% |
| Panamanians | 9.2 /100 | #221 | Tragic 5.6% |
| Cajuns | 6.9 /100 | #222 | Tragic 5.6% |
| Immigrants | Fiji | 6.7 /100 | #223 | Tragic 5.6% |
| Sudanese | 6.4 /100 | #224 | Tragic 5.6% |
| Immigrants | Cambodia | 6.1 /100 | #225 | Tragic 5.6% |
| South Americans | 5.7 /100 | #226 | Tragic 5.6% |
| Immigrants | Zaire | 5.6 /100 | #227 | Tragic 5.6% |
| Arabs | 5.4 /100 | #228 | Tragic 5.7% |
| Sub-Saharan Africans | 4.9 /100 | #229 | Tragic 5.7% |
| Moroccans | 4.9 /100 | #230 | Tragic 5.7% |
| Immigrants | Iraq | 4.4 /100 | #231 | Tragic 5.7% |
| Immigrants | Laos | 4.4 /100 | #232 | Tragic 5.7% |