Immigrants from Croatia vs Chinese Female Poverty
COMPARE
Immigrants from Croatia
Chinese
Female Poverty
Female Poverty Comparison
Immigrants from Croatia
Chinese
12.0%
FEMALE POVERTY
98.7/ 100
METRIC RATING
52nd/ 347
METRIC RANK
10.4%
FEMALE POVERTY
100.0/ 100
METRIC RATING
2nd/ 347
METRIC RANK
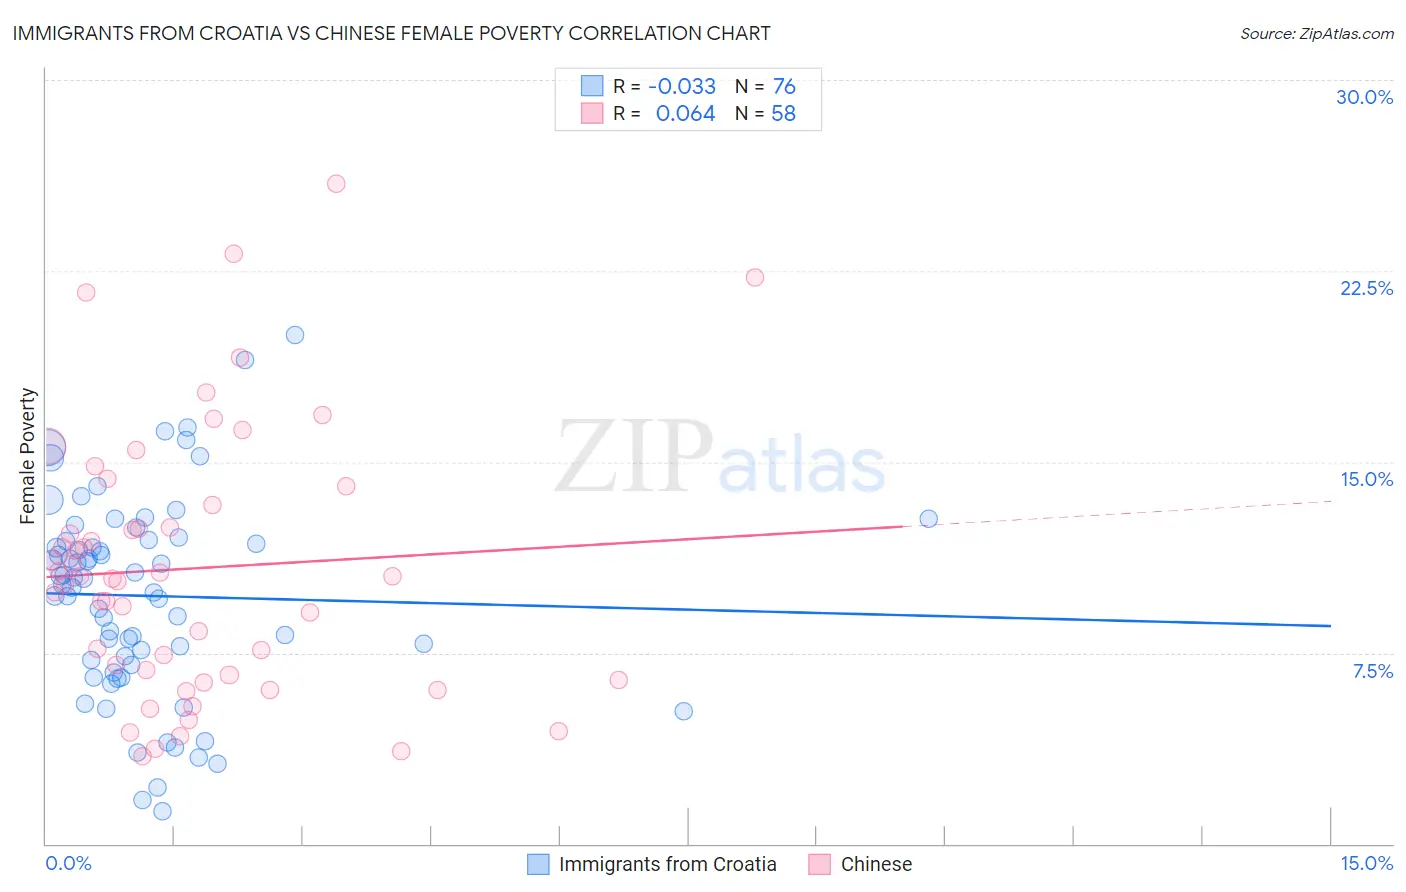
Immigrants from Croatia vs Chinese Female Poverty Correlation Chart
The statistical analysis conducted on geographies consisting of 132,555,435 people shows no correlation between the proportion of Immigrants from Croatia and poverty level among females in the United States with a correlation coefficient (R) of -0.033 and weighted average of 12.0%. Similarly, the statistical analysis conducted on geographies consisting of 64,802,428 people shows a slight positive correlation between the proportion of Chinese and poverty level among females in the United States with a correlation coefficient (R) of 0.064 and weighted average of 10.4%, a difference of 15.8%.
Female Poverty Correlation Summary
| Measurement | Immigrants from Croatia | Chinese |
| Minimum | 1.3% | 3.4% |
| Maximum | 20.0% | 25.9% |
| Range | 18.7% | 22.5% |
| Mean | 9.7% | 10.8% |
| Median | 10.3% | 10.4% |
| Interquartile 25% (IQ1) | 7.1% | 6.6% |
| Interquartile 75% (IQ3) | 11.9% | 13.3% |
| Interquartile Range (IQR) | 4.8% | 6.7% |
| Standard Deviation (Sample) | 3.9% | 5.2% |
| Standard Deviation (Population) | 3.9% | 5.1% |
Similar Demographics by Female Poverty
Demographics Similar to Immigrants from Croatia by Female Poverty
In terms of female poverty, the demographic groups most similar to Immigrants from Croatia are Immigrants from Austria (12.0%, a difference of 0.010%), Immigrants from Philippines (12.1%, a difference of 0.15%), Immigrants from Bulgaria (12.0%, a difference of 0.31%), Immigrants from Sri Lanka (12.1%, a difference of 0.50%), and Slovene (12.0%, a difference of 0.52%).
| Demographics | Rating | Rank | Female Poverty |
| Immigrants | Czechoslovakia | 99.2 /100 | #45 | Exceptional 11.9% |
| Turks | 99.2 /100 | #46 | Exceptional 11.9% |
| Asians | 99.1 /100 | #47 | Exceptional 11.9% |
| Immigrants | Japan | 99.0 /100 | #48 | Exceptional 11.9% |
| Immigrants | Romania | 99.0 /100 | #49 | Exceptional 12.0% |
| Slovenes | 98.9 /100 | #50 | Exceptional 12.0% |
| Immigrants | Bulgaria | 98.9 /100 | #51 | Exceptional 12.0% |
| Immigrants | Croatia | 98.7 /100 | #52 | Exceptional 12.0% |
| Immigrants | Austria | 98.7 /100 | #53 | Exceptional 12.0% |
| Immigrants | Philippines | 98.7 /100 | #54 | Exceptional 12.1% |
| Immigrants | Sri Lanka | 98.5 /100 | #55 | Exceptional 12.1% |
| Estonians | 98.3 /100 | #56 | Exceptional 12.1% |
| Immigrants | Serbia | 98.3 /100 | #57 | Exceptional 12.1% |
| Scandinavians | 98.2 /100 | #58 | Exceptional 12.1% |
| Immigrants | Europe | 98.2 /100 | #59 | Exceptional 12.1% |
Demographics Similar to Chinese by Female Poverty
In terms of female poverty, the demographic groups most similar to Chinese are Thai (10.5%, a difference of 0.65%), Immigrants from Taiwan (10.5%, a difference of 1.4%), Immigrants from India (9.9%, a difference of 5.2%), Filipino (10.9%, a difference of 5.4%), and Immigrants from Ireland (11.0%, a difference of 5.8%).
| Demographics | Rating | Rank | Female Poverty |
| Immigrants | India | 100.0 /100 | #1 | Exceptional 9.9% |
| Chinese | 100.0 /100 | #2 | Exceptional 10.4% |
| Thais | 100.0 /100 | #3 | Exceptional 10.5% |
| Immigrants | Taiwan | 100.0 /100 | #4 | Exceptional 10.5% |
| Filipinos | 100.0 /100 | #5 | Exceptional 10.9% |
| Immigrants | Ireland | 99.9 /100 | #6 | Exceptional 11.0% |
| Assyrians/Chaldeans/Syriacs | 99.9 /100 | #7 | Exceptional 11.0% |
| Immigrants | South Central Asia | 99.9 /100 | #8 | Exceptional 11.1% |
| Bulgarians | 99.9 /100 | #9 | Exceptional 11.1% |
| Immigrants | Hong Kong | 99.9 /100 | #10 | Exceptional 11.2% |
| Maltese | 99.9 /100 | #11 | Exceptional 11.2% |
| Bhutanese | 99.9 /100 | #12 | Exceptional 11.3% |
| Immigrants | Lithuania | 99.9 /100 | #13 | Exceptional 11.3% |
| Lithuanians | 99.8 /100 | #14 | Exceptional 11.4% |
| Latvians | 99.8 /100 | #15 | Exceptional 11.4% |