Immigrants from Western Europe vs Chinese Female Poverty
COMPARE
Immigrants from Western Europe
Chinese
Female Poverty
Female Poverty Comparison
Immigrants from Western Europe
Chinese
12.8%
FEMALE POVERTY
86.6/ 100
METRIC RATING
133rd/ 347
METRIC RANK
10.4%
FEMALE POVERTY
100.0/ 100
METRIC RATING
2nd/ 347
METRIC RANK
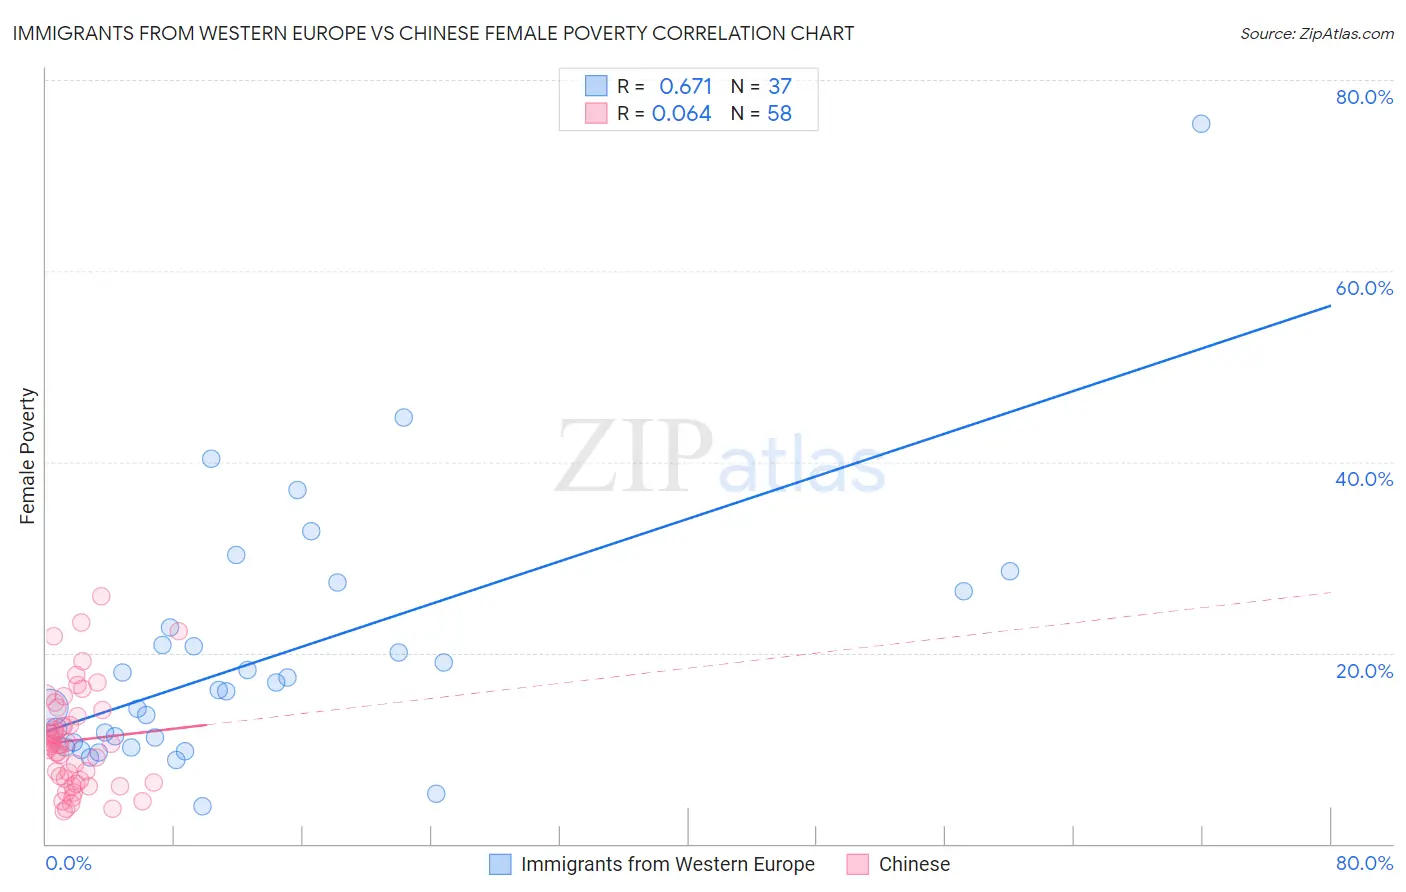
Immigrants from Western Europe vs Chinese Female Poverty Correlation Chart
The statistical analysis conducted on geographies consisting of 493,604,679 people shows a significant positive correlation between the proportion of Immigrants from Western Europe and poverty level among females in the United States with a correlation coefficient (R) of 0.671 and weighted average of 12.8%. Similarly, the statistical analysis conducted on geographies consisting of 64,802,428 people shows a slight positive correlation between the proportion of Chinese and poverty level among females in the United States with a correlation coefficient (R) of 0.064 and weighted average of 10.4%, a difference of 23.6%.
Female Poverty Correlation Summary
| Measurement | Immigrants from Western Europe | Chinese |
| Minimum | 4.0% | 3.4% |
| Maximum | 75.4% | 25.9% |
| Range | 71.4% | 22.5% |
| Mean | 19.6% | 10.8% |
| Median | 16.1% | 10.4% |
| Interquartile 25% (IQ1) | 10.4% | 6.6% |
| Interquartile 75% (IQ3) | 24.5% | 13.3% |
| Interquartile Range (IQR) | 14.2% | 6.7% |
| Standard Deviation (Sample) | 13.5% | 5.2% |
| Standard Deviation (Population) | 13.4% | 5.1% |
Similar Demographics by Female Poverty
Demographics Similar to Immigrants from Western Europe by Female Poverty
In terms of female poverty, the demographic groups most similar to Immigrants from Western Europe are Immigrants from Jordan (12.8%, a difference of 0.060%), Immigrants from Argentina (12.8%, a difference of 0.070%), Immigrants from Vietnam (12.8%, a difference of 0.11%), Immigrants from Switzerland (12.9%, a difference of 0.16%), and French (12.9%, a difference of 0.22%).
| Demographics | Rating | Rank | Female Poverty |
| Immigrants | Ukraine | 88.8 /100 | #126 | Excellent 12.8% |
| South Africans | 88.4 /100 | #127 | Excellent 12.8% |
| Immigrants | Belarus | 88.2 /100 | #128 | Excellent 12.8% |
| Immigrants | Brazil | 87.9 /100 | #129 | Excellent 12.8% |
| Immigrants | Vietnam | 87.1 /100 | #130 | Excellent 12.8% |
| Immigrants | Argentina | 87.0 /100 | #131 | Excellent 12.8% |
| Immigrants | Jordan | 86.9 /100 | #132 | Excellent 12.8% |
| Immigrants | Western Europe | 86.6 /100 | #133 | Excellent 12.8% |
| Immigrants | Switzerland | 85.8 /100 | #134 | Excellent 12.9% |
| French | 85.6 /100 | #135 | Excellent 12.9% |
| Peruvians | 85.2 /100 | #136 | Excellent 12.9% |
| Chileans | 84.7 /100 | #137 | Excellent 12.9% |
| Immigrants | France | 83.6 /100 | #138 | Excellent 12.9% |
| Basques | 83.1 /100 | #139 | Excellent 12.9% |
| Pakistanis | 83.0 /100 | #140 | Excellent 12.9% |
Demographics Similar to Chinese by Female Poverty
In terms of female poverty, the demographic groups most similar to Chinese are Thai (10.5%, a difference of 0.65%), Immigrants from Taiwan (10.5%, a difference of 1.4%), Immigrants from India (9.9%, a difference of 5.2%), Filipino (10.9%, a difference of 5.4%), and Immigrants from Ireland (11.0%, a difference of 5.8%).
| Demographics | Rating | Rank | Female Poverty |
| Immigrants | India | 100.0 /100 | #1 | Exceptional 9.9% |
| Chinese | 100.0 /100 | #2 | Exceptional 10.4% |
| Thais | 100.0 /100 | #3 | Exceptional 10.5% |
| Immigrants | Taiwan | 100.0 /100 | #4 | Exceptional 10.5% |
| Filipinos | 100.0 /100 | #5 | Exceptional 10.9% |
| Immigrants | Ireland | 99.9 /100 | #6 | Exceptional 11.0% |
| Assyrians/Chaldeans/Syriacs | 99.9 /100 | #7 | Exceptional 11.0% |
| Immigrants | South Central Asia | 99.9 /100 | #8 | Exceptional 11.1% |
| Bulgarians | 99.9 /100 | #9 | Exceptional 11.1% |
| Immigrants | Hong Kong | 99.9 /100 | #10 | Exceptional 11.2% |
| Maltese | 99.9 /100 | #11 | Exceptional 11.2% |
| Bhutanese | 99.9 /100 | #12 | Exceptional 11.3% |
| Immigrants | Lithuania | 99.9 /100 | #13 | Exceptional 11.3% |
| Lithuanians | 99.8 /100 | #14 | Exceptional 11.4% |
| Latvians | 99.8 /100 | #15 | Exceptional 11.4% |