Immigrants from Lebanon vs Chinese Female Poverty
COMPARE
Immigrants from Lebanon
Chinese
Female Poverty
Female Poverty Comparison
Immigrants from Lebanon
Chinese
13.8%
FEMALE POVERTY
25.6/ 100
METRIC RATING
199th/ 347
METRIC RANK
10.4%
FEMALE POVERTY
100.0/ 100
METRIC RATING
2nd/ 347
METRIC RANK
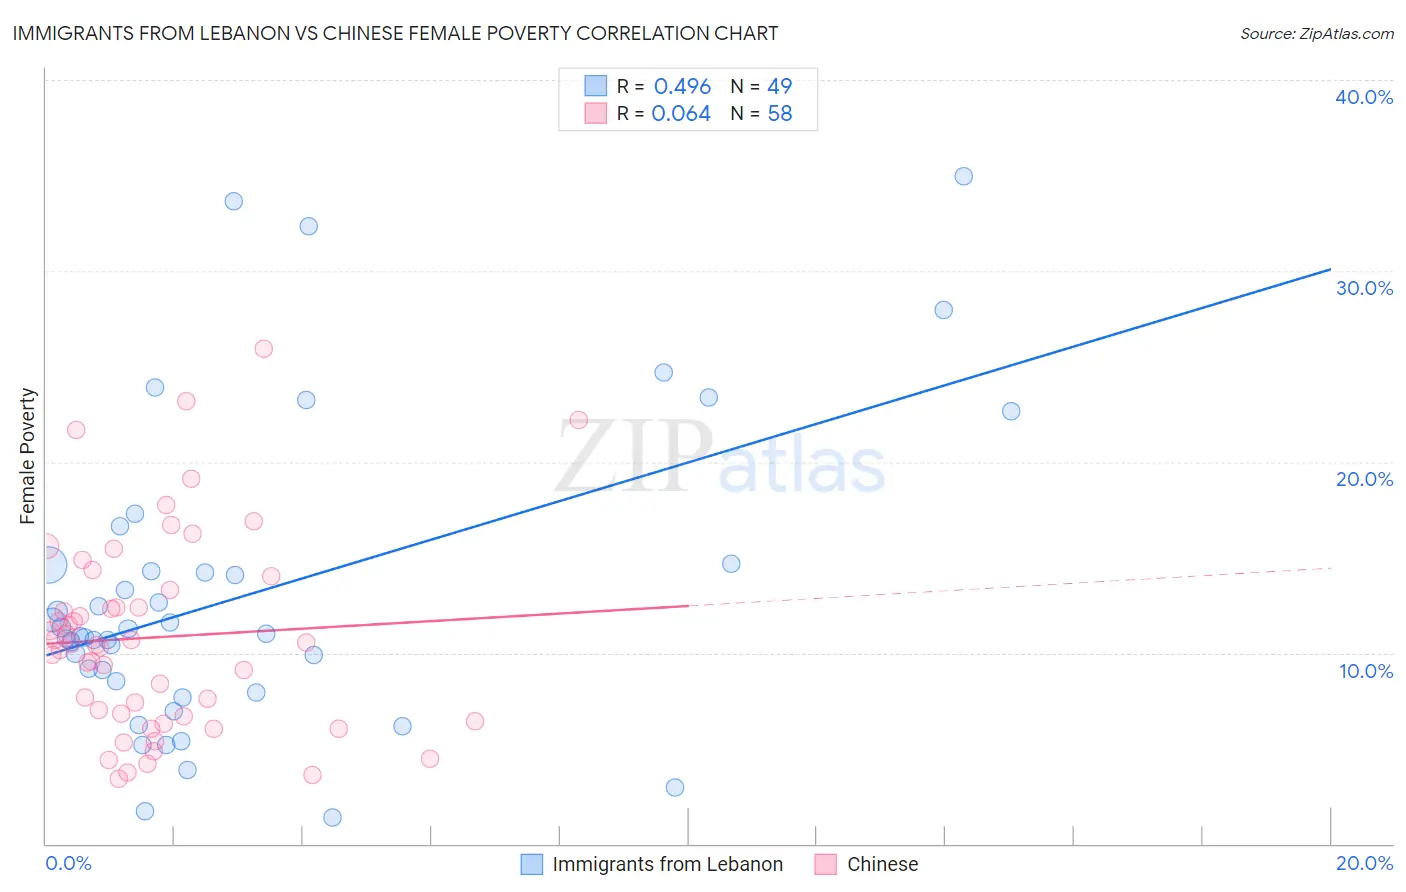
Immigrants from Lebanon vs Chinese Female Poverty Correlation Chart
The statistical analysis conducted on geographies consisting of 217,101,802 people shows a moderate positive correlation between the proportion of Immigrants from Lebanon and poverty level among females in the United States with a correlation coefficient (R) of 0.496 and weighted average of 13.8%. Similarly, the statistical analysis conducted on geographies consisting of 64,802,428 people shows a slight positive correlation between the proportion of Chinese and poverty level among females in the United States with a correlation coefficient (R) of 0.064 and weighted average of 10.4%, a difference of 32.7%.
Female Poverty Correlation Summary
| Measurement | Immigrants from Lebanon | Chinese |
| Minimum | 1.4% | 3.4% |
| Maximum | 35.0% | 25.9% |
| Range | 33.6% | 22.5% |
| Mean | 13.1% | 10.8% |
| Median | 11.0% | 10.4% |
| Interquartile 25% (IQ1) | 8.2% | 6.6% |
| Interquartile 75% (IQ3) | 14.6% | 13.3% |
| Interquartile Range (IQR) | 6.4% | 6.7% |
| Standard Deviation (Sample) | 8.0% | 5.2% |
| Standard Deviation (Population) | 7.9% | 5.1% |
Similar Demographics by Female Poverty
Demographics Similar to Immigrants from Lebanon by Female Poverty
In terms of female poverty, the demographic groups most similar to Immigrants from Lebanon are Immigrants from Uganda (13.7%, a difference of 0.34%), Arab (13.7%, a difference of 0.35%), South American Indian (13.7%, a difference of 0.39%), Spanish (13.9%, a difference of 0.55%), and Immigrants from South America (13.7%, a difference of 0.58%).
| Demographics | Rating | Rank | Female Poverty |
| Immigrants | Costa Rica | 31.9 /100 | #192 | Fair 13.7% |
| Iraqis | 31.8 /100 | #193 | Fair 13.7% |
| Delaware | 31.1 /100 | #194 | Fair 13.7% |
| Immigrants | South America | 30.6 /100 | #195 | Fair 13.7% |
| South American Indians | 28.9 /100 | #196 | Fair 13.7% |
| Arabs | 28.6 /100 | #197 | Fair 13.7% |
| Immigrants | Uganda | 28.5 /100 | #198 | Fair 13.7% |
| Immigrants | Lebanon | 25.6 /100 | #199 | Fair 13.8% |
| Spanish | 21.4 /100 | #200 | Fair 13.9% |
| Immigrants | Kenya | 21.1 /100 | #201 | Fair 13.9% |
| Hmong | 21.1 /100 | #202 | Fair 13.9% |
| Immigrants | Western Asia | 20.7 /100 | #203 | Fair 13.9% |
| Spaniards | 18.9 /100 | #204 | Poor 13.9% |
| Ugandans | 15.4 /100 | #205 | Poor 14.0% |
| Immigrants | Uruguay | 14.0 /100 | #206 | Poor 14.0% |
Demographics Similar to Chinese by Female Poverty
In terms of female poverty, the demographic groups most similar to Chinese are Thai (10.5%, a difference of 0.65%), Immigrants from Taiwan (10.5%, a difference of 1.4%), Immigrants from India (9.9%, a difference of 5.2%), Filipino (10.9%, a difference of 5.4%), and Immigrants from Ireland (11.0%, a difference of 5.8%).
| Demographics | Rating | Rank | Female Poverty |
| Immigrants | India | 100.0 /100 | #1 | Exceptional 9.9% |
| Chinese | 100.0 /100 | #2 | Exceptional 10.4% |
| Thais | 100.0 /100 | #3 | Exceptional 10.5% |
| Immigrants | Taiwan | 100.0 /100 | #4 | Exceptional 10.5% |
| Filipinos | 100.0 /100 | #5 | Exceptional 10.9% |
| Immigrants | Ireland | 99.9 /100 | #6 | Exceptional 11.0% |
| Assyrians/Chaldeans/Syriacs | 99.9 /100 | #7 | Exceptional 11.0% |
| Immigrants | South Central Asia | 99.9 /100 | #8 | Exceptional 11.1% |
| Bulgarians | 99.9 /100 | #9 | Exceptional 11.1% |
| Immigrants | Hong Kong | 99.9 /100 | #10 | Exceptional 11.2% |
| Maltese | 99.9 /100 | #11 | Exceptional 11.2% |
| Bhutanese | 99.9 /100 | #12 | Exceptional 11.3% |
| Immigrants | Lithuania | 99.9 /100 | #13 | Exceptional 11.3% |
| Lithuanians | 99.8 /100 | #14 | Exceptional 11.4% |
| Latvians | 99.8 /100 | #15 | Exceptional 11.4% |