Immigrants from Nicaragua vs Chinese Female Poverty
COMPARE
Immigrants from Nicaragua
Chinese
Female Poverty
Female Poverty Comparison
Immigrants from Nicaragua
Chinese
15.8%
FEMALE POVERTY
0.1/ 100
METRIC RATING
268th/ 347
METRIC RANK
10.4%
FEMALE POVERTY
100.0/ 100
METRIC RATING
2nd/ 347
METRIC RANK
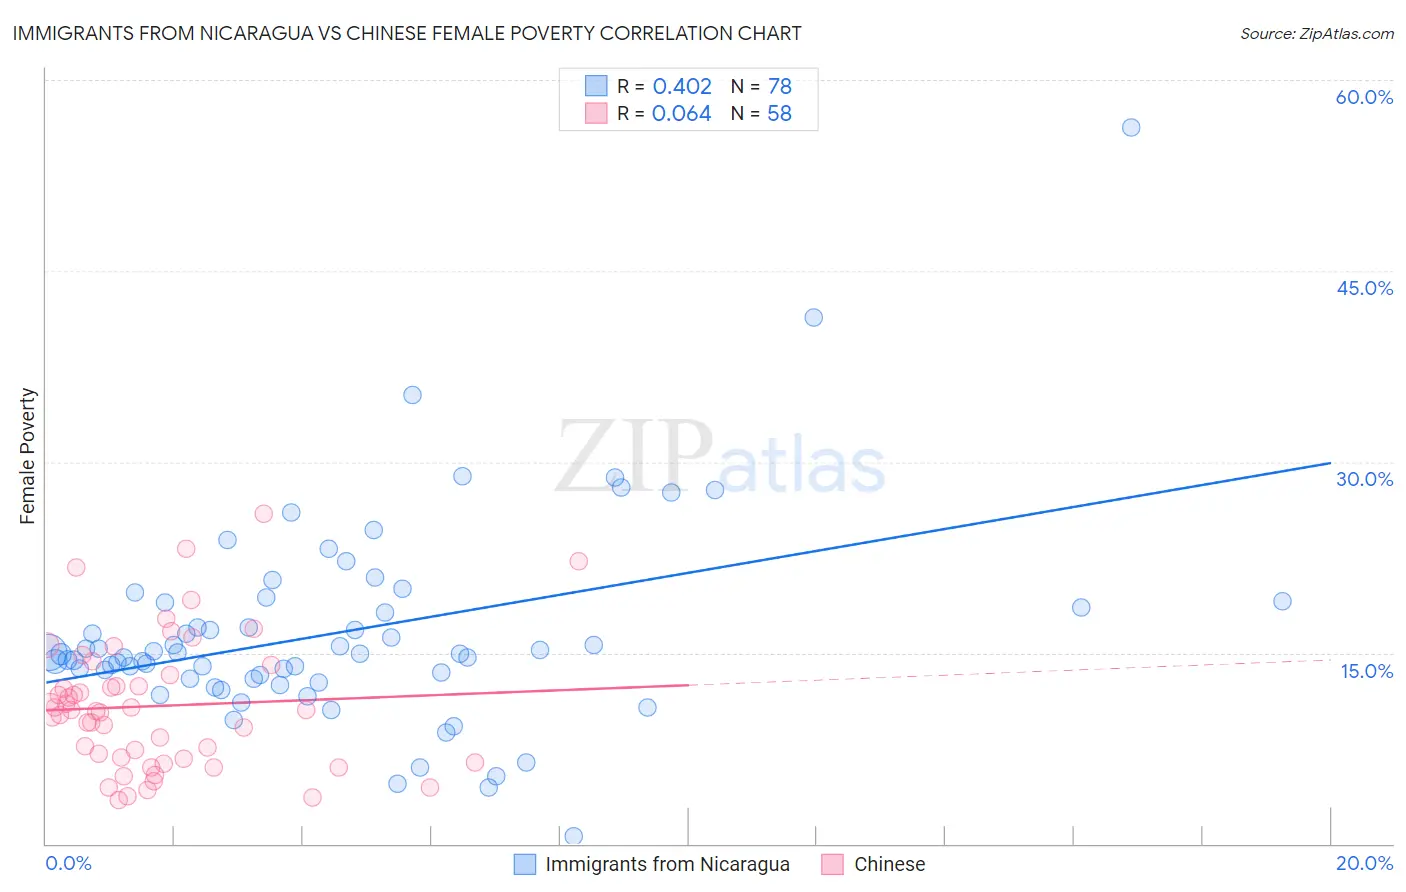
Immigrants from Nicaragua vs Chinese Female Poverty Correlation Chart
The statistical analysis conducted on geographies consisting of 236,310,787 people shows a moderate positive correlation between the proportion of Immigrants from Nicaragua and poverty level among females in the United States with a correlation coefficient (R) of 0.402 and weighted average of 15.8%. Similarly, the statistical analysis conducted on geographies consisting of 64,802,428 people shows a slight positive correlation between the proportion of Chinese and poverty level among females in the United States with a correlation coefficient (R) of 0.064 and weighted average of 10.4%, a difference of 51.7%.
Female Poverty Correlation Summary
| Measurement | Immigrants from Nicaragua | Chinese |
| Minimum | 0.58% | 3.4% |
| Maximum | 56.3% | 25.9% |
| Range | 55.7% | 22.5% |
| Mean | 16.6% | 10.8% |
| Median | 14.9% | 10.4% |
| Interquartile 25% (IQ1) | 13.0% | 6.6% |
| Interquartile 75% (IQ3) | 19.0% | 13.3% |
| Interquartile Range (IQR) | 6.0% | 6.7% |
| Standard Deviation (Sample) | 8.1% | 5.2% |
| Standard Deviation (Population) | 8.0% | 5.1% |
Similar Demographics by Female Poverty
Demographics Similar to Immigrants from Nicaragua by Female Poverty
In terms of female poverty, the demographic groups most similar to Immigrants from Nicaragua are Subsaharan African (15.8%, a difference of 0.060%), Iroquois (15.8%, a difference of 0.37%), Immigrants from El Salvador (15.7%, a difference of 0.49%), Immigrants from Liberia (15.7%, a difference of 0.55%), and Chickasaw (15.9%, a difference of 0.63%).
| Demographics | Rating | Rank | Female Poverty |
| Guyanese | 0.1 /100 | #261 | Tragic 15.6% |
| Mexican American Indians | 0.1 /100 | #262 | Tragic 15.6% |
| Cherokee | 0.1 /100 | #263 | Tragic 15.6% |
| Immigrants | Ecuador | 0.1 /100 | #264 | Tragic 15.6% |
| Immigrants | Liberia | 0.1 /100 | #265 | Tragic 15.7% |
| Immigrants | El Salvador | 0.1 /100 | #266 | Tragic 15.7% |
| Sub-Saharan Africans | 0.1 /100 | #267 | Tragic 15.8% |
| Immigrants | Nicaragua | 0.1 /100 | #268 | Tragic 15.8% |
| Iroquois | 0.1 /100 | #269 | Tragic 15.8% |
| Chickasaw | 0.1 /100 | #270 | Tragic 15.9% |
| Immigrants | St. Vincent and the Grenadines | 0.0 /100 | #271 | Tragic 15.9% |
| Belizeans | 0.0 /100 | #272 | Tragic 15.9% |
| Haitians | 0.0 /100 | #273 | Tragic 15.9% |
| Barbadians | 0.0 /100 | #274 | Tragic 15.9% |
| Immigrants | Barbados | 0.0 /100 | #275 | Tragic 16.0% |
Demographics Similar to Chinese by Female Poverty
In terms of female poverty, the demographic groups most similar to Chinese are Thai (10.5%, a difference of 0.65%), Immigrants from Taiwan (10.5%, a difference of 1.4%), Immigrants from India (9.9%, a difference of 5.2%), Filipino (10.9%, a difference of 5.4%), and Immigrants from Ireland (11.0%, a difference of 5.8%).
| Demographics | Rating | Rank | Female Poverty |
| Immigrants | India | 100.0 /100 | #1 | Exceptional 9.9% |
| Chinese | 100.0 /100 | #2 | Exceptional 10.4% |
| Thais | 100.0 /100 | #3 | Exceptional 10.5% |
| Immigrants | Taiwan | 100.0 /100 | #4 | Exceptional 10.5% |
| Filipinos | 100.0 /100 | #5 | Exceptional 10.9% |
| Immigrants | Ireland | 99.9 /100 | #6 | Exceptional 11.0% |
| Assyrians/Chaldeans/Syriacs | 99.9 /100 | #7 | Exceptional 11.0% |
| Immigrants | South Central Asia | 99.9 /100 | #8 | Exceptional 11.1% |
| Bulgarians | 99.9 /100 | #9 | Exceptional 11.1% |
| Immigrants | Hong Kong | 99.9 /100 | #10 | Exceptional 11.2% |
| Maltese | 99.9 /100 | #11 | Exceptional 11.2% |
| Bhutanese | 99.9 /100 | #12 | Exceptional 11.3% |
| Immigrants | Lithuania | 99.9 /100 | #13 | Exceptional 11.3% |
| Lithuanians | 99.8 /100 | #14 | Exceptional 11.4% |
| Latvians | 99.8 /100 | #15 | Exceptional 11.4% |