Immigrants from Congo vs Sioux Female Poverty
COMPARE
Immigrants from Congo
Sioux
Female Poverty
Female Poverty Comparison
Immigrants from Congo
Sioux
17.4%
FEMALE POVERTY
0.0/ 100
METRIC RATING
317th/ 347
METRIC RANK
20.9%
FEMALE POVERTY
0.0/ 100
METRIC RATING
338th/ 347
METRIC RANK
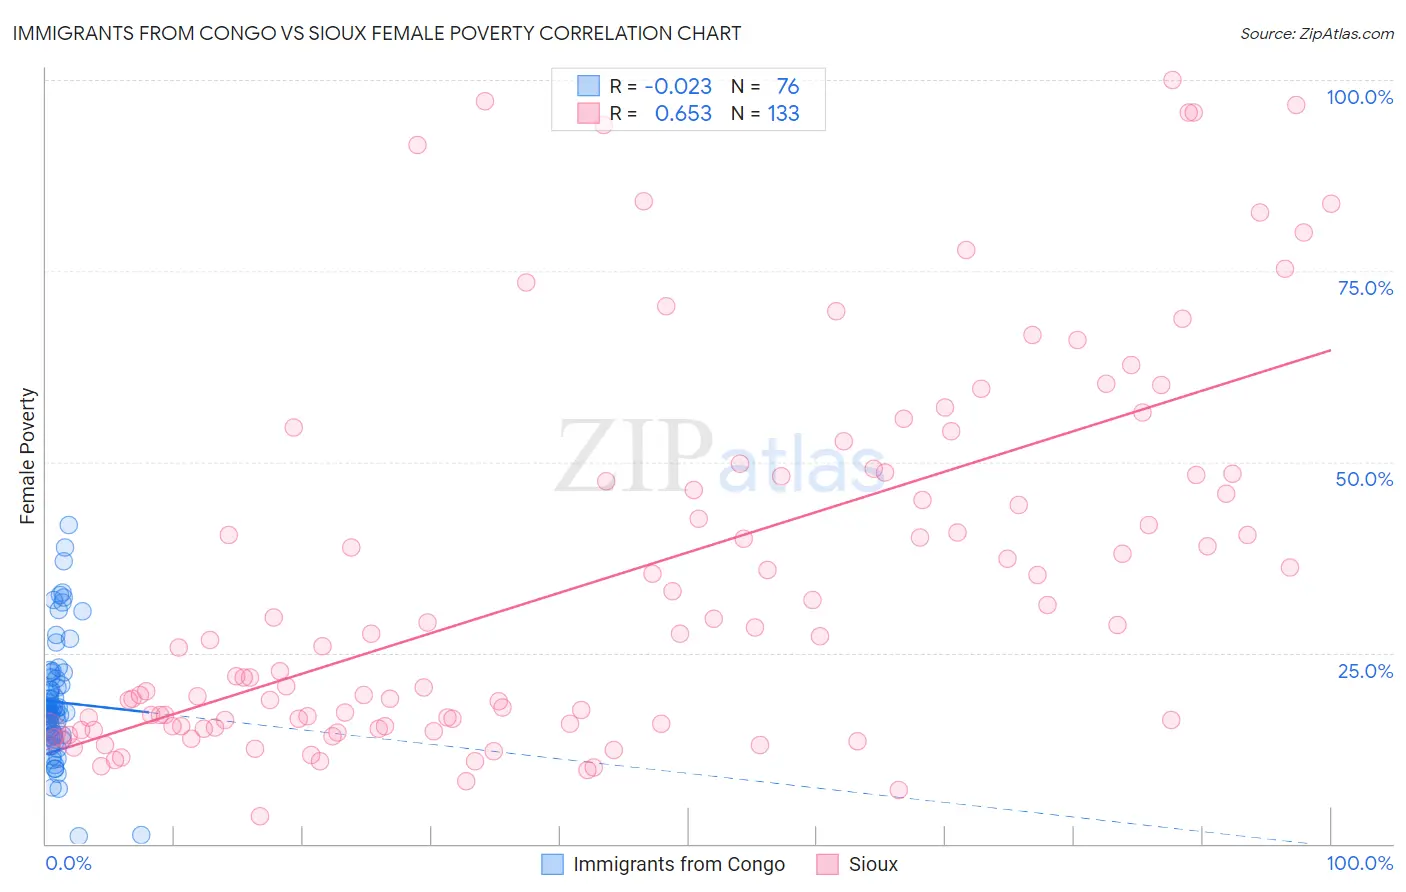
Immigrants from Congo vs Sioux Female Poverty Correlation Chart
The statistical analysis conducted on geographies consisting of 92,087,948 people shows no correlation between the proportion of Immigrants from Congo and poverty level among females in the United States with a correlation coefficient (R) of -0.023 and weighted average of 17.4%. Similarly, the statistical analysis conducted on geographies consisting of 234,087,584 people shows a significant positive correlation between the proportion of Sioux and poverty level among females in the United States with a correlation coefficient (R) of 0.653 and weighted average of 20.9%, a difference of 20.0%.
Female Poverty Correlation Summary
| Measurement | Immigrants from Congo | Sioux |
| Minimum | 0.94% | 3.5% |
| Maximum | 41.7% | 100.0% |
| Range | 40.8% | 96.5% |
| Mean | 18.6% | 34.8% |
| Median | 17.3% | 26.7% |
| Interquartile 25% (IQ1) | 14.1% | 15.4% |
| Interquartile 75% (IQ3) | 21.6% | 48.4% |
| Interquartile Range (IQR) | 7.6% | 33.0% |
| Standard Deviation (Sample) | 7.8% | 24.5% |
| Standard Deviation (Population) | 7.8% | 24.4% |
Similar Demographics by Female Poverty
Demographics Similar to Immigrants from Congo by Female Poverty
In terms of female poverty, the demographic groups most similar to Immigrants from Congo are Honduran (17.4%, a difference of 0.19%), Ute (17.5%, a difference of 0.32%), Cajun (17.5%, a difference of 0.34%), Immigrants from Dominica (17.5%, a difference of 0.42%), and Arapaho (17.5%, a difference of 0.48%).
| Demographics | Rating | Rank | Female Poverty |
| Creek | 0.0 /100 | #310 | Tragic 17.0% |
| Immigrants | Guatemala | 0.0 /100 | #311 | Tragic 17.0% |
| Immigrants | Somalia | 0.0 /100 | #312 | Tragic 17.0% |
| British West Indians | 0.0 /100 | #313 | Tragic 17.0% |
| Dutch West Indians | 0.0 /100 | #314 | Tragic 17.1% |
| U.S. Virgin Islanders | 0.0 /100 | #315 | Tragic 17.3% |
| Hondurans | 0.0 /100 | #316 | Tragic 17.4% |
| Immigrants | Congo | 0.0 /100 | #317 | Tragic 17.4% |
| Ute | 0.0 /100 | #318 | Tragic 17.5% |
| Cajuns | 0.0 /100 | #319 | Tragic 17.5% |
| Immigrants | Dominica | 0.0 /100 | #320 | Tragic 17.5% |
| Arapaho | 0.0 /100 | #321 | Tragic 17.5% |
| Menominee | 0.0 /100 | #322 | Tragic 17.6% |
| Paiute | 0.0 /100 | #323 | Tragic 17.7% |
| Immigrants | Honduras | 0.0 /100 | #324 | Tragic 17.7% |
Demographics Similar to Sioux by Female Poverty
In terms of female poverty, the demographic groups most similar to Sioux are Yuman (20.8%, a difference of 0.19%), Hopi (21.0%, a difference of 0.37%), Pueblo (20.7%, a difference of 1.0%), Yup'ik (21.5%, a difference of 2.9%), and Cheyenne (20.2%, a difference of 3.4%).
| Demographics | Rating | Rank | Female Poverty |
| Natives/Alaskans | 0.0 /100 | #331 | Tragic 19.2% |
| Apache | 0.0 /100 | #332 | Tragic 19.2% |
| Immigrants | Dominican Republic | 0.0 /100 | #333 | Tragic 19.3% |
| Houma | 0.0 /100 | #334 | Tragic 20.0% |
| Cheyenne | 0.0 /100 | #335 | Tragic 20.2% |
| Pueblo | 0.0 /100 | #336 | Tragic 20.7% |
| Yuman | 0.0 /100 | #337 | Tragic 20.8% |
| Sioux | 0.0 /100 | #338 | Tragic 20.9% |
| Hopi | 0.0 /100 | #339 | Tragic 21.0% |
| Yup'ik | 0.0 /100 | #340 | Tragic 21.5% |
| Crow | 0.0 /100 | #341 | Tragic 22.1% |
| Immigrants | Yemen | 0.0 /100 | #342 | Tragic 22.8% |
| Lumbee | 0.0 /100 | #343 | Tragic 23.5% |
| Pima | 0.0 /100 | #344 | Tragic 23.6% |
| Navajo | 0.0 /100 | #345 | Tragic 23.9% |