Immigrants from Iran vs Sioux Female Poverty
COMPARE
Immigrants from Iran
Sioux
Female Poverty
Female Poverty Comparison
Immigrants from Iran
Sioux
11.8%
FEMALE POVERTY
99.4/ 100
METRIC RATING
35th/ 347
METRIC RANK
20.9%
FEMALE POVERTY
0.0/ 100
METRIC RATING
338th/ 347
METRIC RANK
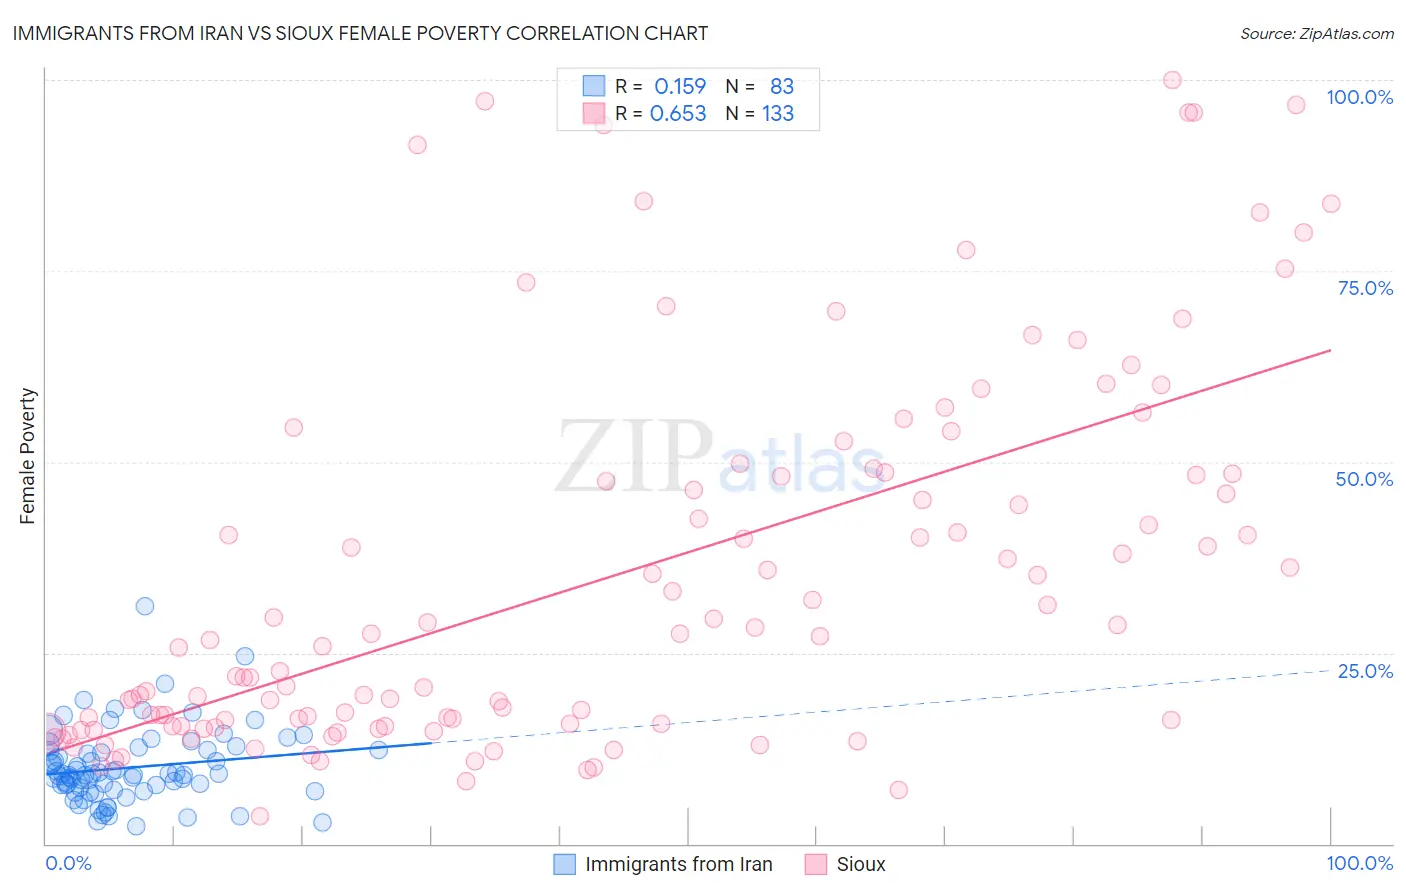
Immigrants from Iran vs Sioux Female Poverty Correlation Chart
The statistical analysis conducted on geographies consisting of 279,829,066 people shows a poor positive correlation between the proportion of Immigrants from Iran and poverty level among females in the United States with a correlation coefficient (R) of 0.159 and weighted average of 11.8%. Similarly, the statistical analysis conducted on geographies consisting of 234,087,584 people shows a significant positive correlation between the proportion of Sioux and poverty level among females in the United States with a correlation coefficient (R) of 0.653 and weighted average of 20.9%, a difference of 77.2%.
Female Poverty Correlation Summary
| Measurement | Immigrants from Iran | Sioux |
| Minimum | 2.3% | 3.5% |
| Maximum | 31.0% | 100.0% |
| Range | 28.7% | 96.5% |
| Mean | 10.0% | 34.8% |
| Median | 9.1% | 26.7% |
| Interquartile 25% (IQ1) | 7.0% | 15.4% |
| Interquartile 75% (IQ3) | 12.3% | 48.4% |
| Interquartile Range (IQR) | 5.2% | 33.0% |
| Standard Deviation (Sample) | 4.9% | 24.5% |
| Standard Deviation (Population) | 4.8% | 24.4% |
Similar Demographics by Female Poverty
Demographics Similar to Immigrants from Iran by Female Poverty
In terms of female poverty, the demographic groups most similar to Immigrants from Iran are Immigrants from Singapore (11.8%, a difference of 0.17%), Immigrants from Pakistan (11.8%, a difference of 0.17%), Immigrants from Greece (11.8%, a difference of 0.27%), Russian (11.8%, a difference of 0.28%), and Cypriot (11.8%, a difference of 0.29%).
| Demographics | Rating | Rank | Female Poverty |
| Immigrants | Korea | 99.6 /100 | #28 | Exceptional 11.7% |
| Immigrants | North Macedonia | 99.6 /100 | #29 | Exceptional 11.7% |
| Greeks | 99.5 /100 | #30 | Exceptional 11.7% |
| Poles | 99.5 /100 | #31 | Exceptional 11.7% |
| Danes | 99.5 /100 | #32 | Exceptional 11.7% |
| Cypriots | 99.5 /100 | #33 | Exceptional 11.8% |
| Immigrants | Singapore | 99.4 /100 | #34 | Exceptional 11.8% |
| Immigrants | Iran | 99.4 /100 | #35 | Exceptional 11.8% |
| Immigrants | Pakistan | 99.4 /100 | #36 | Exceptional 11.8% |
| Immigrants | Greece | 99.3 /100 | #37 | Exceptional 11.8% |
| Russians | 99.3 /100 | #38 | Exceptional 11.8% |
| Immigrants | Poland | 99.3 /100 | #39 | Exceptional 11.8% |
| Macedonians | 99.3 /100 | #40 | Exceptional 11.8% |
| Czechs | 99.2 /100 | #41 | Exceptional 11.9% |
| Immigrants | Moldova | 99.2 /100 | #42 | Exceptional 11.9% |
Demographics Similar to Sioux by Female Poverty
In terms of female poverty, the demographic groups most similar to Sioux are Yuman (20.8%, a difference of 0.19%), Hopi (21.0%, a difference of 0.37%), Pueblo (20.7%, a difference of 1.0%), Yup'ik (21.5%, a difference of 2.9%), and Cheyenne (20.2%, a difference of 3.4%).
| Demographics | Rating | Rank | Female Poverty |
| Natives/Alaskans | 0.0 /100 | #331 | Tragic 19.2% |
| Apache | 0.0 /100 | #332 | Tragic 19.2% |
| Immigrants | Dominican Republic | 0.0 /100 | #333 | Tragic 19.3% |
| Houma | 0.0 /100 | #334 | Tragic 20.0% |
| Cheyenne | 0.0 /100 | #335 | Tragic 20.2% |
| Pueblo | 0.0 /100 | #336 | Tragic 20.7% |
| Yuman | 0.0 /100 | #337 | Tragic 20.8% |
| Sioux | 0.0 /100 | #338 | Tragic 20.9% |
| Hopi | 0.0 /100 | #339 | Tragic 21.0% |
| Yup'ik | 0.0 /100 | #340 | Tragic 21.5% |
| Crow | 0.0 /100 | #341 | Tragic 22.1% |
| Immigrants | Yemen | 0.0 /100 | #342 | Tragic 22.8% |
| Lumbee | 0.0 /100 | #343 | Tragic 23.5% |
| Pima | 0.0 /100 | #344 | Tragic 23.6% |
| Navajo | 0.0 /100 | #345 | Tragic 23.9% |