Trinidadian and Tobagonian vs Sioux Female Poverty
COMPARE
Trinidadian and Tobagonian
Sioux
Female Poverty
Female Poverty Comparison
Trinidadians and Tobagonians
Sioux
15.4%
FEMALE POVERTY
0.2/ 100
METRIC RATING
254th/ 347
METRIC RANK
20.9%
FEMALE POVERTY
0.0/ 100
METRIC RATING
338th/ 347
METRIC RANK
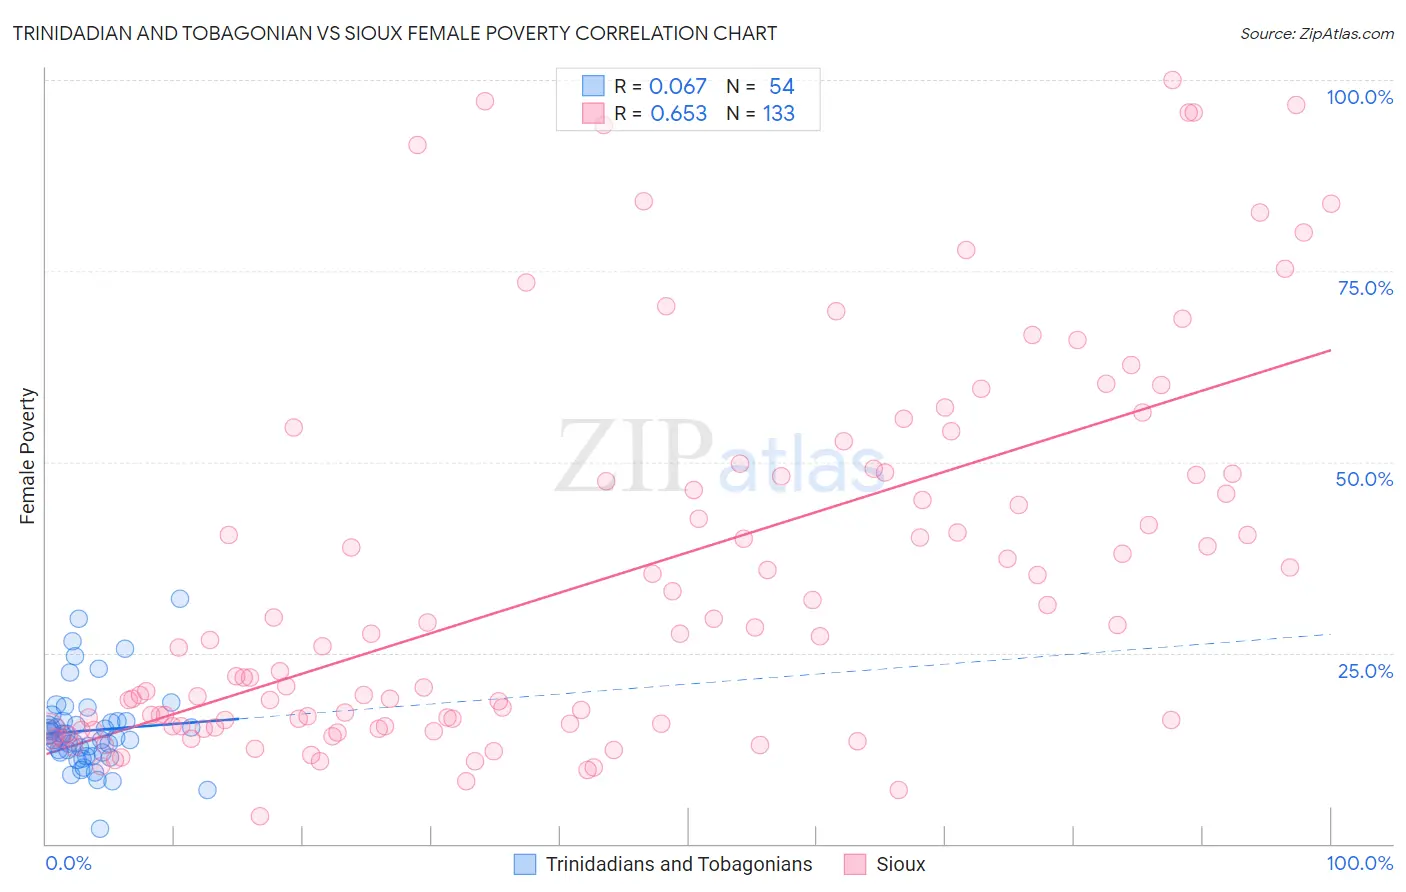
Trinidadian and Tobagonian vs Sioux Female Poverty Correlation Chart
The statistical analysis conducted on geographies consisting of 219,692,358 people shows a slight positive correlation between the proportion of Trinidadians and Tobagonians and poverty level among females in the United States with a correlation coefficient (R) of 0.067 and weighted average of 15.4%. Similarly, the statistical analysis conducted on geographies consisting of 234,087,584 people shows a significant positive correlation between the proportion of Sioux and poverty level among females in the United States with a correlation coefficient (R) of 0.653 and weighted average of 20.9%, a difference of 35.2%.
Female Poverty Correlation Summary
| Measurement | Trinidadian and Tobagonian | Sioux |
| Minimum | 2.0% | 3.5% |
| Maximum | 32.1% | 100.0% |
| Range | 30.1% | 96.5% |
| Mean | 14.8% | 34.8% |
| Median | 13.9% | 26.7% |
| Interquartile 25% (IQ1) | 11.9% | 15.4% |
| Interquartile 75% (IQ3) | 16.1% | 48.4% |
| Interquartile Range (IQR) | 4.2% | 33.0% |
| Standard Deviation (Sample) | 5.5% | 24.5% |
| Standard Deviation (Population) | 5.4% | 24.4% |
Similar Demographics by Female Poverty
Demographics Similar to Trinidadians and Tobagonians by Female Poverty
In terms of female poverty, the demographic groups most similar to Trinidadians and Tobagonians are Liberian (15.4%, a difference of 0.24%), Ottawa (15.5%, a difference of 0.31%), Immigrants from Burma/Myanmar (15.4%, a difference of 0.50%), Immigrants from Trinidad and Tobago (15.4%, a difference of 0.53%), and Jamaican (15.5%, a difference of 0.61%).
| Demographics | Rating | Rank | Female Poverty |
| Potawatomi | 0.3 /100 | #247 | Tragic 15.3% |
| Immigrants | Ghana | 0.3 /100 | #248 | Tragic 15.3% |
| Salvadorans | 0.3 /100 | #249 | Tragic 15.3% |
| Immigrants | Western Africa | 0.3 /100 | #250 | Tragic 15.3% |
| Immigrants | Trinidad and Tobago | 0.3 /100 | #251 | Tragic 15.4% |
| Immigrants | Burma/Myanmar | 0.3 /100 | #252 | Tragic 15.4% |
| Liberians | 0.2 /100 | #253 | Tragic 15.4% |
| Trinidadians and Tobagonians | 0.2 /100 | #254 | Tragic 15.4% |
| Ottawa | 0.2 /100 | #255 | Tragic 15.5% |
| Jamaicans | 0.2 /100 | #256 | Tragic 15.5% |
| Immigrants | Jamaica | 0.1 /100 | #257 | Tragic 15.6% |
| Shoshone | 0.1 /100 | #258 | Tragic 15.6% |
| Cape Verdeans | 0.1 /100 | #259 | Tragic 15.6% |
| Immigrants | Guyana | 0.1 /100 | #260 | Tragic 15.6% |
| Guyanese | 0.1 /100 | #261 | Tragic 15.6% |
Demographics Similar to Sioux by Female Poverty
In terms of female poverty, the demographic groups most similar to Sioux are Yuman (20.8%, a difference of 0.19%), Hopi (21.0%, a difference of 0.37%), Pueblo (20.7%, a difference of 1.0%), Yup'ik (21.5%, a difference of 2.9%), and Cheyenne (20.2%, a difference of 3.4%).
| Demographics | Rating | Rank | Female Poverty |
| Natives/Alaskans | 0.0 /100 | #331 | Tragic 19.2% |
| Apache | 0.0 /100 | #332 | Tragic 19.2% |
| Immigrants | Dominican Republic | 0.0 /100 | #333 | Tragic 19.3% |
| Houma | 0.0 /100 | #334 | Tragic 20.0% |
| Cheyenne | 0.0 /100 | #335 | Tragic 20.2% |
| Pueblo | 0.0 /100 | #336 | Tragic 20.7% |
| Yuman | 0.0 /100 | #337 | Tragic 20.8% |
| Sioux | 0.0 /100 | #338 | Tragic 20.9% |
| Hopi | 0.0 /100 | #339 | Tragic 21.0% |
| Yup'ik | 0.0 /100 | #340 | Tragic 21.5% |
| Crow | 0.0 /100 | #341 | Tragic 22.1% |
| Immigrants | Yemen | 0.0 /100 | #342 | Tragic 22.8% |
| Lumbee | 0.0 /100 | #343 | Tragic 23.5% |
| Pima | 0.0 /100 | #344 | Tragic 23.6% |
| Navajo | 0.0 /100 | #345 | Tragic 23.9% |