Immigrants from Congo vs Immigrants from El Salvador Female Poverty
COMPARE
Immigrants from Congo
Immigrants from El Salvador
Female Poverty
Female Poverty Comparison
Immigrants from Congo
Immigrants from El Salvador
17.4%
FEMALE POVERTY
0.0/ 100
METRIC RATING
317th/ 347
METRIC RANK
15.7%
FEMALE POVERTY
0.1/ 100
METRIC RATING
266th/ 347
METRIC RANK
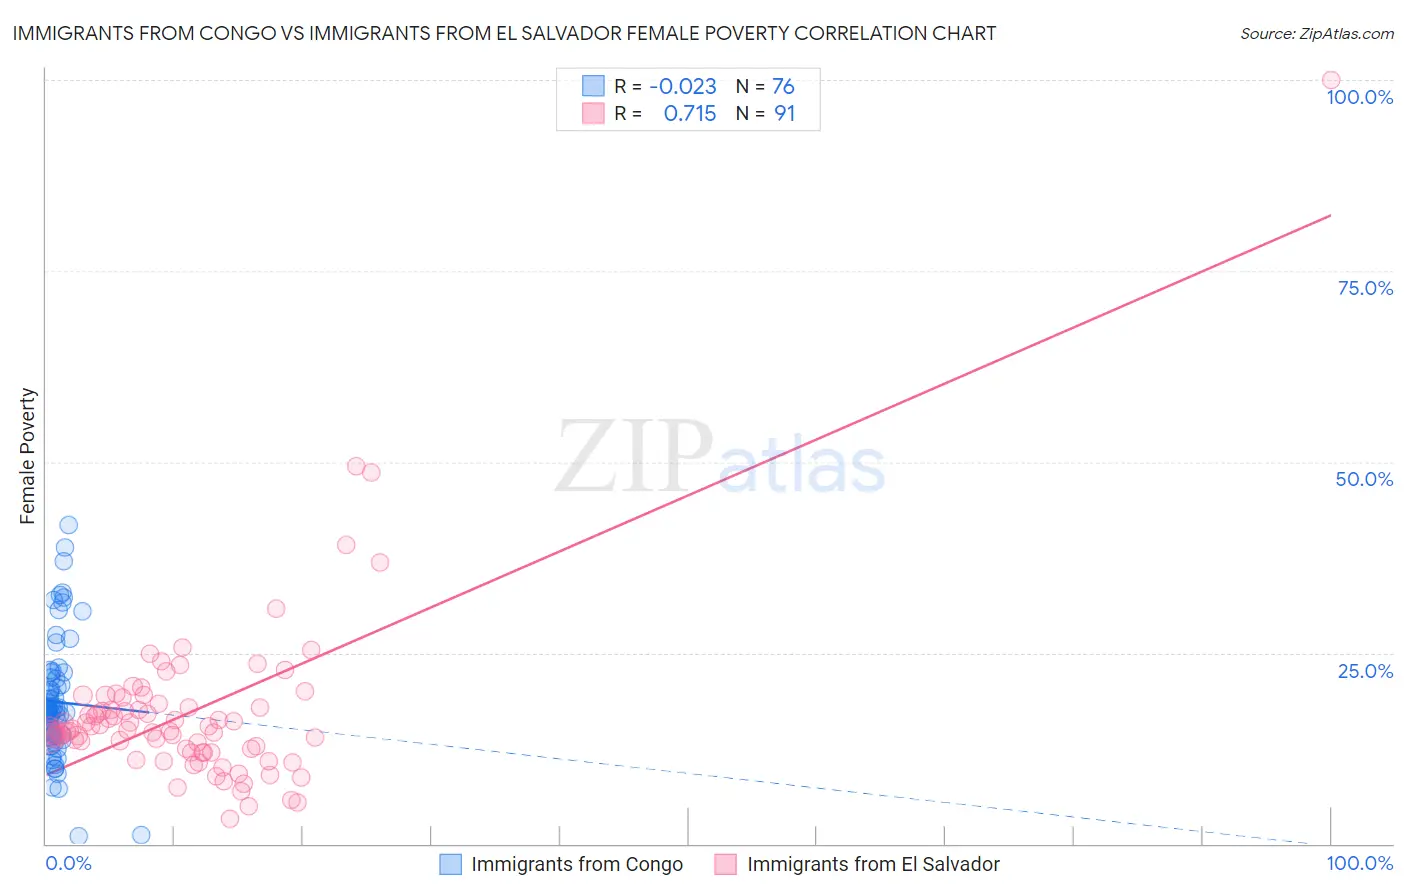
Immigrants from Congo vs Immigrants from El Salvador Female Poverty Correlation Chart
The statistical analysis conducted on geographies consisting of 92,087,948 people shows no correlation between the proportion of Immigrants from Congo and poverty level among females in the United States with a correlation coefficient (R) of -0.023 and weighted average of 17.4%. Similarly, the statistical analysis conducted on geographies consisting of 357,675,141 people shows a strong positive correlation between the proportion of Immigrants from El Salvador and poverty level among females in the United States with a correlation coefficient (R) of 0.715 and weighted average of 15.7%, a difference of 10.9%.
Female Poverty Correlation Summary
| Measurement | Immigrants from Congo | Immigrants from El Salvador |
| Minimum | 0.94% | 3.3% |
| Maximum | 41.7% | 100.0% |
| Range | 40.8% | 96.7% |
| Mean | 18.6% | 17.2% |
| Median | 17.3% | 14.8% |
| Interquartile 25% (IQ1) | 14.1% | 12.0% |
| Interquartile 75% (IQ3) | 21.6% | 18.3% |
| Interquartile Range (IQR) | 7.6% | 6.3% |
| Standard Deviation (Sample) | 7.8% | 11.7% |
| Standard Deviation (Population) | 7.8% | 11.6% |
Similar Demographics by Female Poverty
Demographics Similar to Immigrants from Congo by Female Poverty
In terms of female poverty, the demographic groups most similar to Immigrants from Congo are Honduran (17.4%, a difference of 0.19%), Ute (17.5%, a difference of 0.32%), Cajun (17.5%, a difference of 0.34%), Immigrants from Dominica (17.5%, a difference of 0.42%), and Arapaho (17.5%, a difference of 0.48%).
| Demographics | Rating | Rank | Female Poverty |
| Creek | 0.0 /100 | #310 | Tragic 17.0% |
| Immigrants | Guatemala | 0.0 /100 | #311 | Tragic 17.0% |
| Immigrants | Somalia | 0.0 /100 | #312 | Tragic 17.0% |
| British West Indians | 0.0 /100 | #313 | Tragic 17.0% |
| Dutch West Indians | 0.0 /100 | #314 | Tragic 17.1% |
| U.S. Virgin Islanders | 0.0 /100 | #315 | Tragic 17.3% |
| Hondurans | 0.0 /100 | #316 | Tragic 17.4% |
| Immigrants | Congo | 0.0 /100 | #317 | Tragic 17.4% |
| Ute | 0.0 /100 | #318 | Tragic 17.5% |
| Cajuns | 0.0 /100 | #319 | Tragic 17.5% |
| Immigrants | Dominica | 0.0 /100 | #320 | Tragic 17.5% |
| Arapaho | 0.0 /100 | #321 | Tragic 17.5% |
| Menominee | 0.0 /100 | #322 | Tragic 17.6% |
| Paiute | 0.0 /100 | #323 | Tragic 17.7% |
| Immigrants | Honduras | 0.0 /100 | #324 | Tragic 17.7% |
Demographics Similar to Immigrants from El Salvador by Female Poverty
In terms of female poverty, the demographic groups most similar to Immigrants from El Salvador are Immigrants from Liberia (15.7%, a difference of 0.060%), Immigrants from Ecuador (15.6%, a difference of 0.36%), Subsaharan African (15.8%, a difference of 0.43%), Cherokee (15.6%, a difference of 0.49%), and Immigrants from Nicaragua (15.8%, a difference of 0.49%).
| Demographics | Rating | Rank | Female Poverty |
| Cape Verdeans | 0.1 /100 | #259 | Tragic 15.6% |
| Immigrants | Guyana | 0.1 /100 | #260 | Tragic 15.6% |
| Guyanese | 0.1 /100 | #261 | Tragic 15.6% |
| Mexican American Indians | 0.1 /100 | #262 | Tragic 15.6% |
| Cherokee | 0.1 /100 | #263 | Tragic 15.6% |
| Immigrants | Ecuador | 0.1 /100 | #264 | Tragic 15.6% |
| Immigrants | Liberia | 0.1 /100 | #265 | Tragic 15.7% |
| Immigrants | El Salvador | 0.1 /100 | #266 | Tragic 15.7% |
| Sub-Saharan Africans | 0.1 /100 | #267 | Tragic 15.8% |
| Immigrants | Nicaragua | 0.1 /100 | #268 | Tragic 15.8% |
| Iroquois | 0.1 /100 | #269 | Tragic 15.8% |
| Chickasaw | 0.1 /100 | #270 | Tragic 15.9% |
| Immigrants | St. Vincent and the Grenadines | 0.0 /100 | #271 | Tragic 15.9% |
| Belizeans | 0.0 /100 | #272 | Tragic 15.9% |
| Haitians | 0.0 /100 | #273 | Tragic 15.9% |