Immigrants from Uganda vs Sioux Female Poverty
COMPARE
Immigrants from Uganda
Sioux
Female Poverty
Female Poverty Comparison
Immigrants from Uganda
Sioux
13.7%
FEMALE POVERTY
28.5/ 100
METRIC RATING
198th/ 347
METRIC RANK
20.9%
FEMALE POVERTY
0.0/ 100
METRIC RATING
338th/ 347
METRIC RANK
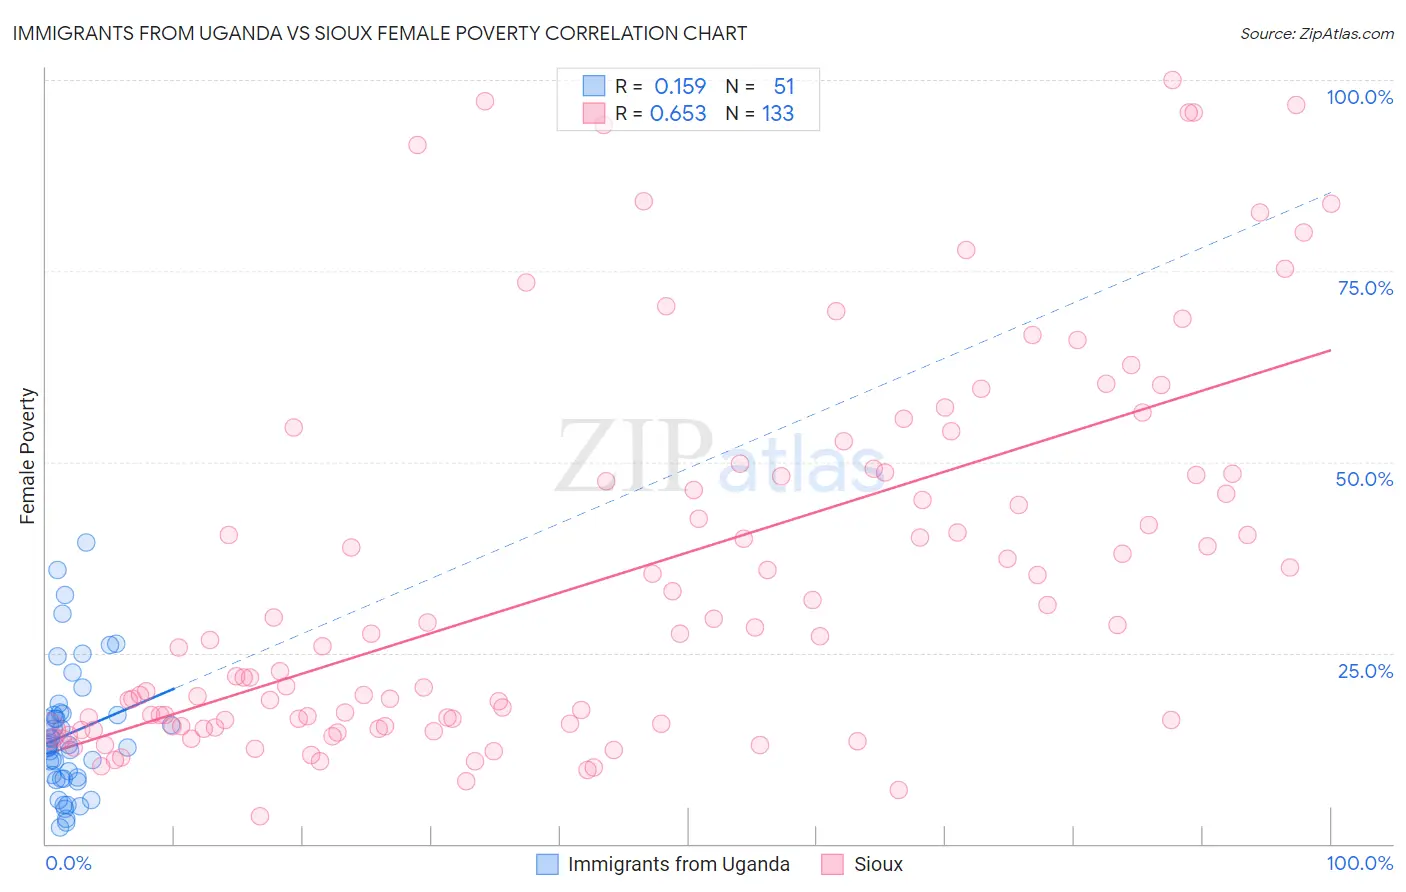
Immigrants from Uganda vs Sioux Female Poverty Correlation Chart
The statistical analysis conducted on geographies consisting of 125,969,010 people shows a poor positive correlation between the proportion of Immigrants from Uganda and poverty level among females in the United States with a correlation coefficient (R) of 0.159 and weighted average of 13.7%. Similarly, the statistical analysis conducted on geographies consisting of 234,087,584 people shows a significant positive correlation between the proportion of Sioux and poverty level among females in the United States with a correlation coefficient (R) of 0.653 and weighted average of 20.9%, a difference of 52.0%.
Female Poverty Correlation Summary
| Measurement | Immigrants from Uganda | Sioux |
| Minimum | 2.1% | 3.5% |
| Maximum | 39.4% | 100.0% |
| Range | 37.3% | 96.5% |
| Mean | 14.4% | 34.8% |
| Median | 12.9% | 26.7% |
| Interquartile 25% (IQ1) | 8.5% | 15.4% |
| Interquartile 75% (IQ3) | 17.0% | 48.4% |
| Interquartile Range (IQR) | 8.5% | 33.0% |
| Standard Deviation (Sample) | 8.4% | 24.5% |
| Standard Deviation (Population) | 8.3% | 24.4% |
Similar Demographics by Female Poverty
Demographics Similar to Immigrants from Uganda by Female Poverty
In terms of female poverty, the demographic groups most similar to Immigrants from Uganda are Arab (13.7%, a difference of 0.010%), South American Indian (13.7%, a difference of 0.060%), Immigrants from South America (13.7%, a difference of 0.25%), Delaware (13.7%, a difference of 0.30%), and Immigrants from Lebanon (13.8%, a difference of 0.34%).
| Demographics | Rating | Rank | Female Poverty |
| Immigrants | Kuwait | 32.7 /100 | #191 | Fair 13.7% |
| Immigrants | Costa Rica | 31.9 /100 | #192 | Fair 13.7% |
| Iraqis | 31.8 /100 | #193 | Fair 13.7% |
| Delaware | 31.1 /100 | #194 | Fair 13.7% |
| Immigrants | South America | 30.6 /100 | #195 | Fair 13.7% |
| South American Indians | 28.9 /100 | #196 | Fair 13.7% |
| Arabs | 28.6 /100 | #197 | Fair 13.7% |
| Immigrants | Uganda | 28.5 /100 | #198 | Fair 13.7% |
| Immigrants | Lebanon | 25.6 /100 | #199 | Fair 13.8% |
| Spanish | 21.4 /100 | #200 | Fair 13.9% |
| Immigrants | Kenya | 21.1 /100 | #201 | Fair 13.9% |
| Hmong | 21.1 /100 | #202 | Fair 13.9% |
| Immigrants | Western Asia | 20.7 /100 | #203 | Fair 13.9% |
| Spaniards | 18.9 /100 | #204 | Poor 13.9% |
| Ugandans | 15.4 /100 | #205 | Poor 14.0% |
Demographics Similar to Sioux by Female Poverty
In terms of female poverty, the demographic groups most similar to Sioux are Yuman (20.8%, a difference of 0.19%), Hopi (21.0%, a difference of 0.37%), Pueblo (20.7%, a difference of 1.0%), Yup'ik (21.5%, a difference of 2.9%), and Cheyenne (20.2%, a difference of 3.4%).
| Demographics | Rating | Rank | Female Poverty |
| Natives/Alaskans | 0.0 /100 | #331 | Tragic 19.2% |
| Apache | 0.0 /100 | #332 | Tragic 19.2% |
| Immigrants | Dominican Republic | 0.0 /100 | #333 | Tragic 19.3% |
| Houma | 0.0 /100 | #334 | Tragic 20.0% |
| Cheyenne | 0.0 /100 | #335 | Tragic 20.2% |
| Pueblo | 0.0 /100 | #336 | Tragic 20.7% |
| Yuman | 0.0 /100 | #337 | Tragic 20.8% |
| Sioux | 0.0 /100 | #338 | Tragic 20.9% |
| Hopi | 0.0 /100 | #339 | Tragic 21.0% |
| Yup'ik | 0.0 /100 | #340 | Tragic 21.5% |
| Crow | 0.0 /100 | #341 | Tragic 22.1% |
| Immigrants | Yemen | 0.0 /100 | #342 | Tragic 22.8% |
| Lumbee | 0.0 /100 | #343 | Tragic 23.5% |
| Pima | 0.0 /100 | #344 | Tragic 23.6% |
| Navajo | 0.0 /100 | #345 | Tragic 23.9% |