Jamaican vs Sioux Female Poverty
COMPARE
Jamaican
Sioux
Female Poverty
Female Poverty Comparison
Jamaicans
Sioux
15.5%
FEMALE POVERTY
0.2/ 100
METRIC RATING
256th/ 347
METRIC RANK
20.9%
FEMALE POVERTY
0.0/ 100
METRIC RATING
338th/ 347
METRIC RANK
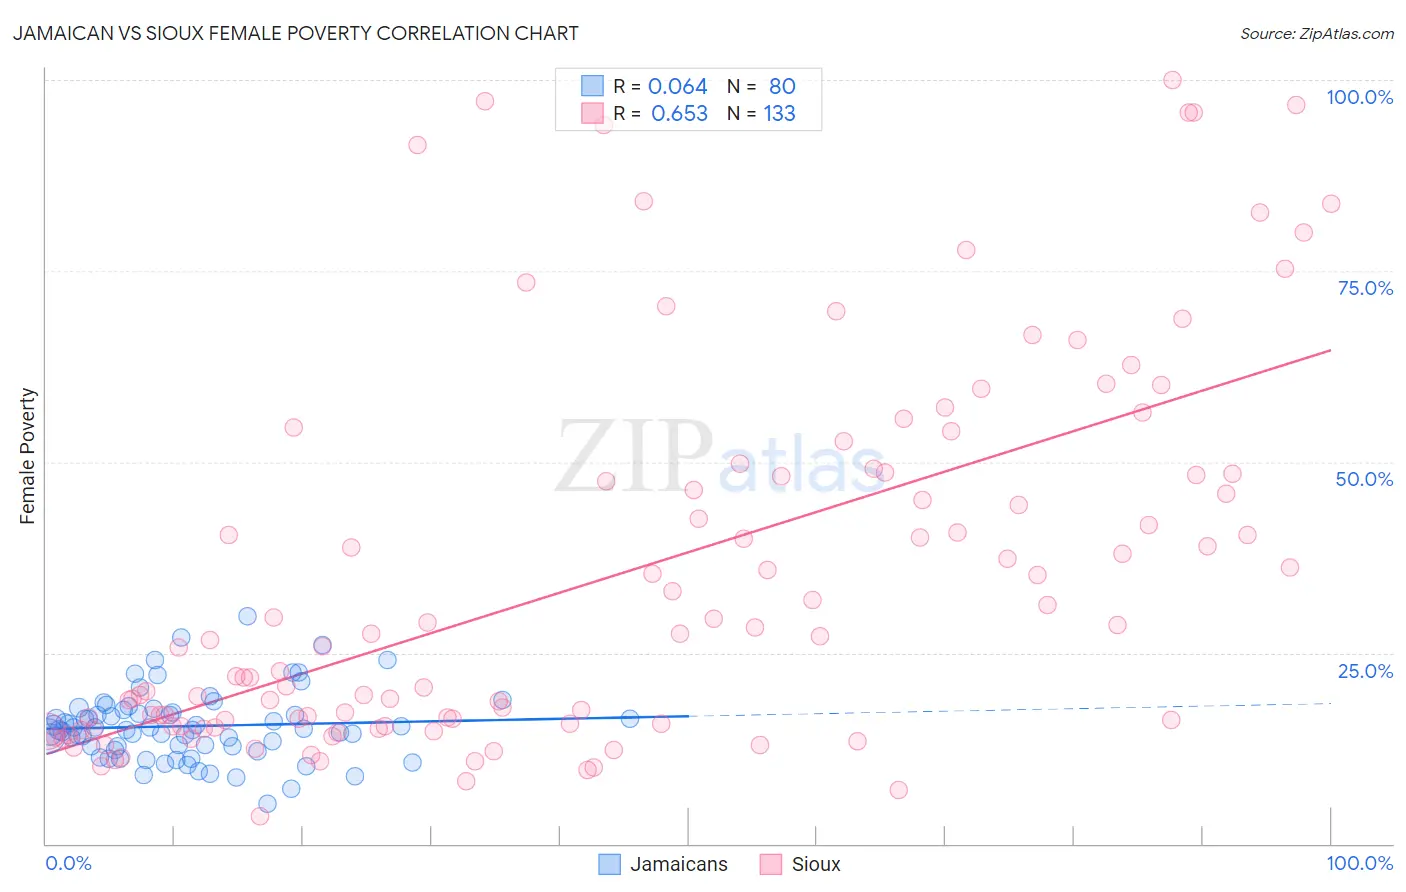
Jamaican vs Sioux Female Poverty Correlation Chart
The statistical analysis conducted on geographies consisting of 367,594,174 people shows a slight positive correlation between the proportion of Jamaicans and poverty level among females in the United States with a correlation coefficient (R) of 0.064 and weighted average of 15.5%. Similarly, the statistical analysis conducted on geographies consisting of 234,087,584 people shows a significant positive correlation between the proportion of Sioux and poverty level among females in the United States with a correlation coefficient (R) of 0.653 and weighted average of 20.9%, a difference of 34.4%.
Female Poverty Correlation Summary
| Measurement | Jamaican | Sioux |
| Minimum | 5.3% | 3.5% |
| Maximum | 29.8% | 100.0% |
| Range | 24.5% | 96.5% |
| Mean | 15.4% | 34.8% |
| Median | 15.0% | 26.7% |
| Interquartile 25% (IQ1) | 12.8% | 15.4% |
| Interquartile 75% (IQ3) | 17.3% | 48.4% |
| Interquartile Range (IQR) | 4.5% | 33.0% |
| Standard Deviation (Sample) | 4.5% | 24.5% |
| Standard Deviation (Population) | 4.5% | 24.4% |
Similar Demographics by Female Poverty
Demographics Similar to Jamaicans by Female Poverty
In terms of female poverty, the demographic groups most similar to Jamaicans are Immigrants from Jamaica (15.6%, a difference of 0.12%), Shoshone (15.6%, a difference of 0.19%), Ottawa (15.5%, a difference of 0.30%), Cape Verdean (15.6%, a difference of 0.30%), and Immigrants from Guyana (15.6%, a difference of 0.38%).
| Demographics | Rating | Rank | Female Poverty |
| Salvadorans | 0.3 /100 | #249 | Tragic 15.3% |
| Immigrants | Western Africa | 0.3 /100 | #250 | Tragic 15.3% |
| Immigrants | Trinidad and Tobago | 0.3 /100 | #251 | Tragic 15.4% |
| Immigrants | Burma/Myanmar | 0.3 /100 | #252 | Tragic 15.4% |
| Liberians | 0.2 /100 | #253 | Tragic 15.4% |
| Trinidadians and Tobagonians | 0.2 /100 | #254 | Tragic 15.4% |
| Ottawa | 0.2 /100 | #255 | Tragic 15.5% |
| Jamaicans | 0.2 /100 | #256 | Tragic 15.5% |
| Immigrants | Jamaica | 0.1 /100 | #257 | Tragic 15.6% |
| Shoshone | 0.1 /100 | #258 | Tragic 15.6% |
| Cape Verdeans | 0.1 /100 | #259 | Tragic 15.6% |
| Immigrants | Guyana | 0.1 /100 | #260 | Tragic 15.6% |
| Guyanese | 0.1 /100 | #261 | Tragic 15.6% |
| Mexican American Indians | 0.1 /100 | #262 | Tragic 15.6% |
| Cherokee | 0.1 /100 | #263 | Tragic 15.6% |
Demographics Similar to Sioux by Female Poverty
In terms of female poverty, the demographic groups most similar to Sioux are Yuman (20.8%, a difference of 0.19%), Hopi (21.0%, a difference of 0.37%), Pueblo (20.7%, a difference of 1.0%), Yup'ik (21.5%, a difference of 2.9%), and Cheyenne (20.2%, a difference of 3.4%).
| Demographics | Rating | Rank | Female Poverty |
| Natives/Alaskans | 0.0 /100 | #331 | Tragic 19.2% |
| Apache | 0.0 /100 | #332 | Tragic 19.2% |
| Immigrants | Dominican Republic | 0.0 /100 | #333 | Tragic 19.3% |
| Houma | 0.0 /100 | #334 | Tragic 20.0% |
| Cheyenne | 0.0 /100 | #335 | Tragic 20.2% |
| Pueblo | 0.0 /100 | #336 | Tragic 20.7% |
| Yuman | 0.0 /100 | #337 | Tragic 20.8% |
| Sioux | 0.0 /100 | #338 | Tragic 20.9% |
| Hopi | 0.0 /100 | #339 | Tragic 21.0% |
| Yup'ik | 0.0 /100 | #340 | Tragic 21.5% |
| Crow | 0.0 /100 | #341 | Tragic 22.1% |
| Immigrants | Yemen | 0.0 /100 | #342 | Tragic 22.8% |
| Lumbee | 0.0 /100 | #343 | Tragic 23.5% |
| Pima | 0.0 /100 | #344 | Tragic 23.6% |
| Navajo | 0.0 /100 | #345 | Tragic 23.9% |