Immigrants from Congo vs Somali Female Poverty
COMPARE
Immigrants from Congo
Somali
Female Poverty
Female Poverty Comparison
Immigrants from Congo
Somalis
17.4%
FEMALE POVERTY
0.0/ 100
METRIC RATING
317th/ 347
METRIC RANK
16.6%
FEMALE POVERTY
0.0/ 100
METRIC RATING
298th/ 347
METRIC RANK
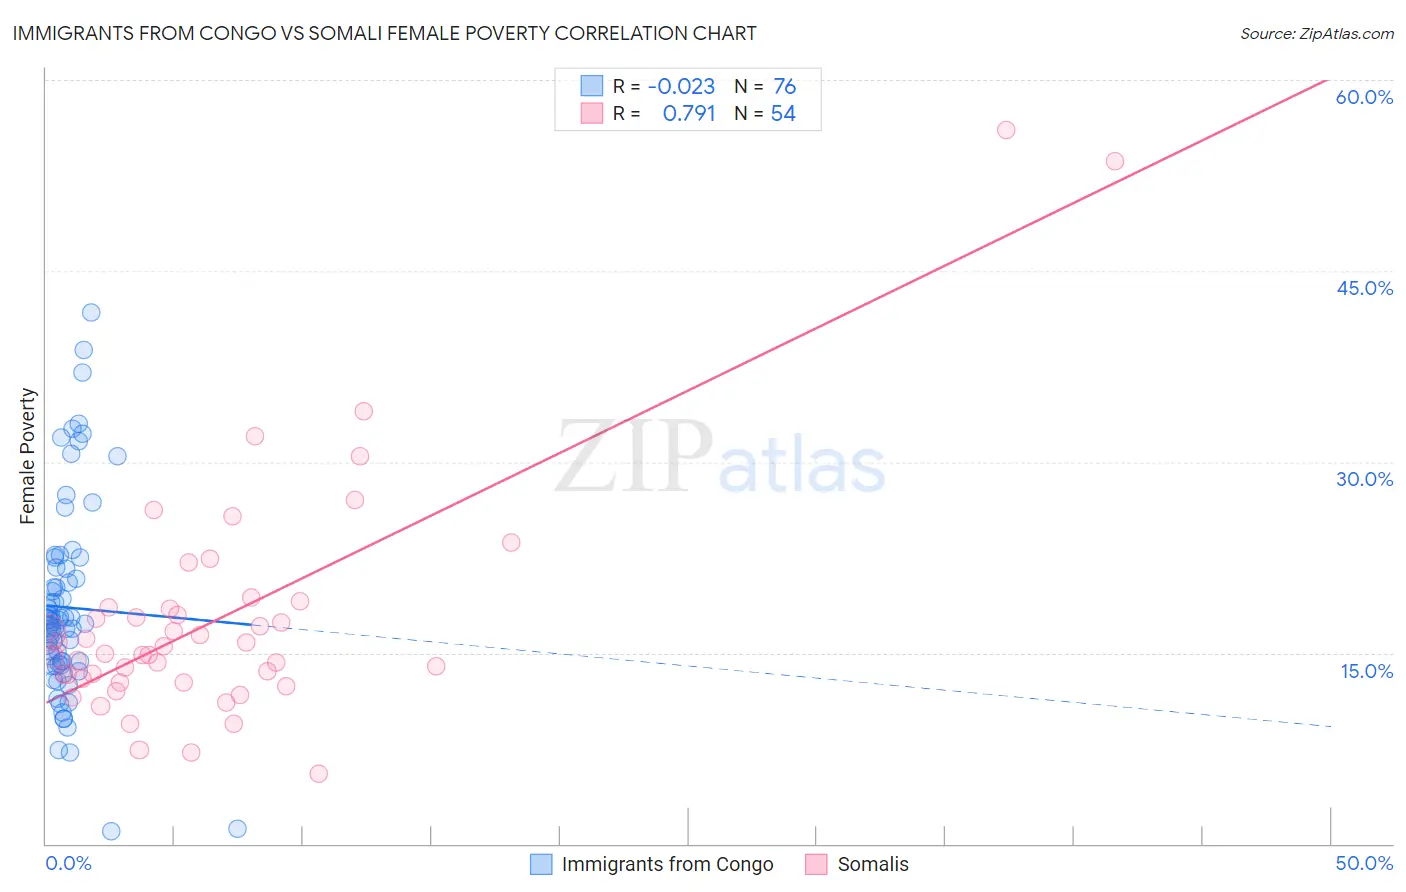
Immigrants from Congo vs Somali Female Poverty Correlation Chart
The statistical analysis conducted on geographies consisting of 92,087,948 people shows no correlation between the proportion of Immigrants from Congo and poverty level among females in the United States with a correlation coefficient (R) of -0.023 and weighted average of 17.4%. Similarly, the statistical analysis conducted on geographies consisting of 99,282,230 people shows a strong positive correlation between the proportion of Somalis and poverty level among females in the United States with a correlation coefficient (R) of 0.791 and weighted average of 16.6%, a difference of 5.1%.
Female Poverty Correlation Summary
| Measurement | Immigrants from Congo | Somali |
| Minimum | 0.94% | 5.5% |
| Maximum | 41.7% | 56.1% |
| Range | 40.8% | 50.6% |
| Mean | 18.6% | 17.8% |
| Median | 17.3% | 15.2% |
| Interquartile 25% (IQ1) | 14.1% | 13.0% |
| Interquartile 75% (IQ3) | 21.6% | 18.6% |
| Interquartile Range (IQR) | 7.6% | 5.6% |
| Standard Deviation (Sample) | 7.8% | 9.4% |
| Standard Deviation (Population) | 7.8% | 9.3% |
Demographics Similar to Immigrants from Congo and Somalis by Female Poverty
In terms of female poverty, the demographic groups most similar to Immigrants from Congo are Honduran (17.4%, a difference of 0.19%), U.S. Virgin Islander (17.3%, a difference of 0.49%), Dutch West Indian (17.1%, a difference of 1.9%), British West Indian (17.0%, a difference of 2.1%), and Immigrants from Somalia (17.0%, a difference of 2.2%). Similarly, the demographic groups most similar to Somalis are Mexican (16.5%, a difference of 0.20%), Hispanic or Latino (16.6%, a difference of 0.52%), Bahamian (16.6%, a difference of 0.56%), Guatemalan (16.7%, a difference of 0.90%), and Chippewa (16.7%, a difference of 0.93%).
| Demographics | Rating | Rank | Female Poverty |
| Mexicans | 0.0 /100 | #297 | Tragic 16.5% |
| Somalis | 0.0 /100 | #298 | Tragic 16.6% |
| Hispanics or Latinos | 0.0 /100 | #299 | Tragic 16.6% |
| Bahamians | 0.0 /100 | #300 | Tragic 16.6% |
| Guatemalans | 0.0 /100 | #301 | Tragic 16.7% |
| Chippewa | 0.0 /100 | #302 | Tragic 16.7% |
| Choctaw | 0.0 /100 | #303 | Tragic 16.8% |
| Immigrants | Central America | 0.0 /100 | #304 | Tragic 16.8% |
| Immigrants | Grenada | 0.0 /100 | #305 | Tragic 16.8% |
| Immigrants | Caribbean | 0.0 /100 | #306 | Tragic 16.9% |
| Seminole | 0.0 /100 | #307 | Tragic 16.9% |
| Africans | 0.0 /100 | #308 | Tragic 16.9% |
| Immigrants | Mexico | 0.0 /100 | #309 | Tragic 17.0% |
| Creek | 0.0 /100 | #310 | Tragic 17.0% |
| Immigrants | Guatemala | 0.0 /100 | #311 | Tragic 17.0% |
| Immigrants | Somalia | 0.0 /100 | #312 | Tragic 17.0% |
| British West Indians | 0.0 /100 | #313 | Tragic 17.0% |
| Dutch West Indians | 0.0 /100 | #314 | Tragic 17.1% |
| U.S. Virgin Islanders | 0.0 /100 | #315 | Tragic 17.3% |
| Hondurans | 0.0 /100 | #316 | Tragic 17.4% |
| Immigrants | Congo | 0.0 /100 | #317 | Tragic 17.4% |