Immigrants from China vs Shoshone Poverty
COMPARE
Immigrants from China
Shoshone
Poverty
Poverty Comparison
Immigrants from China
Shoshone
11.6%
POVERTY
90.7/ 100
METRIC RATING
114th/ 347
METRIC RANK
14.7%
POVERTY
0.0/ 100
METRIC RATING
271st/ 347
METRIC RANK
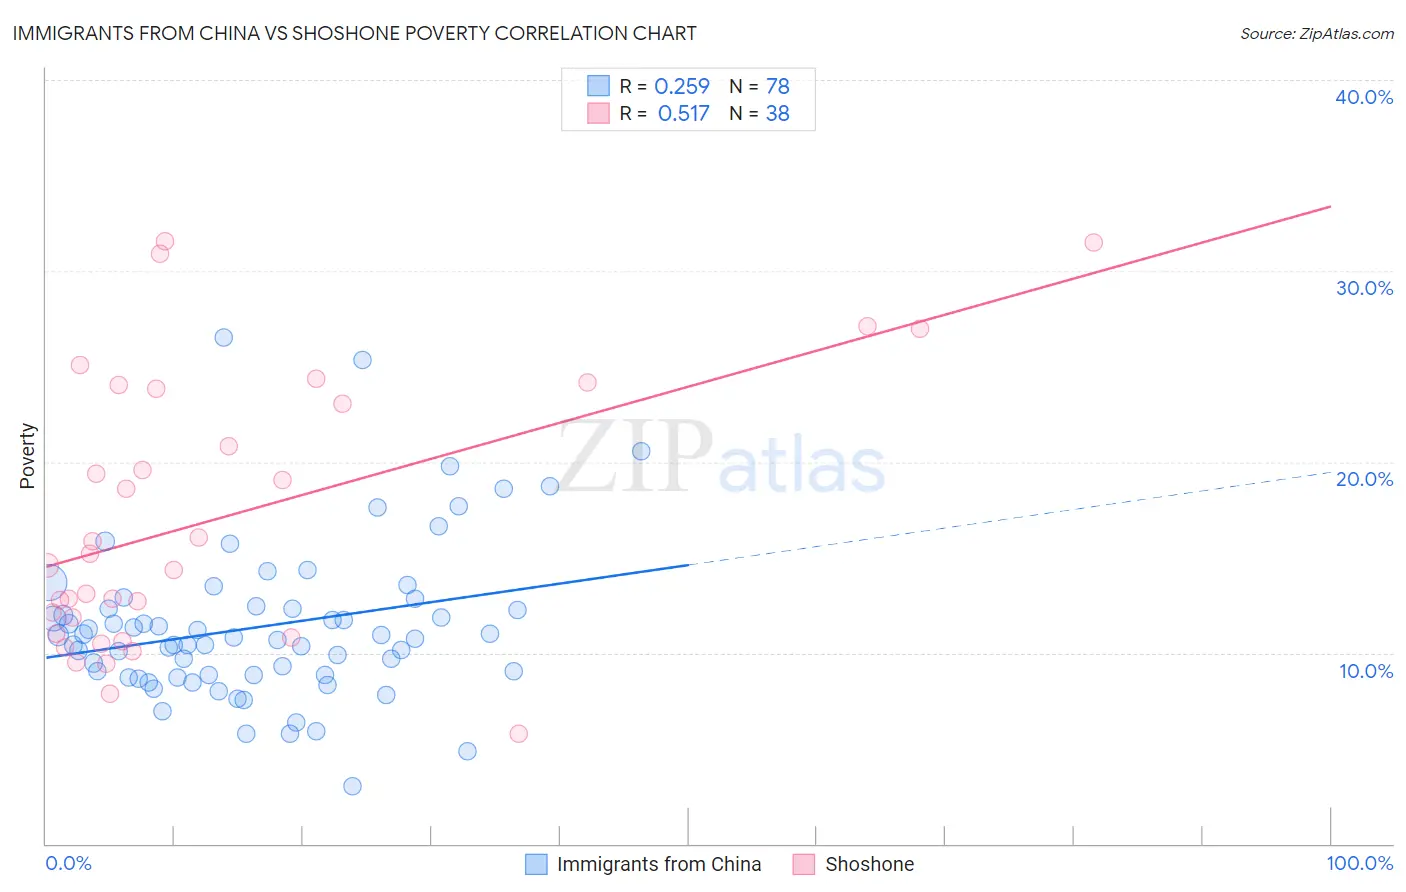
Immigrants from China vs Shoshone Poverty Correlation Chart
The statistical analysis conducted on geographies consisting of 456,587,979 people shows a weak positive correlation between the proportion of Immigrants from China and poverty level in the United States with a correlation coefficient (R) of 0.259 and weighted average of 11.6%. Similarly, the statistical analysis conducted on geographies consisting of 66,616,342 people shows a substantial positive correlation between the proportion of Shoshone and poverty level in the United States with a correlation coefficient (R) of 0.517 and weighted average of 14.7%, a difference of 26.0%.
Poverty Correlation Summary
| Measurement | Immigrants from China | Shoshone |
| Minimum | 3.0% | 5.7% |
| Maximum | 26.5% | 31.5% |
| Range | 23.5% | 25.8% |
| Mean | 11.4% | 17.1% |
| Median | 10.8% | 14.9% |
| Interquartile 25% (IQ1) | 8.8% | 11.0% |
| Interquartile 75% (IQ3) | 12.3% | 23.8% |
| Interquartile Range (IQR) | 3.5% | 12.8% |
| Standard Deviation (Sample) | 4.1% | 7.1% |
| Standard Deviation (Population) | 4.1% | 7.0% |
Similar Demographics by Poverty
Demographics Similar to Immigrants from China by Poverty
In terms of poverty, the demographic groups most similar to Immigrants from China are Immigrants from Southern Europe (11.6%, a difference of 0.020%), Immigrants from Belarus (11.6%, a difference of 0.020%), French Canadian (11.6%, a difference of 0.090%), Albanian (11.7%, a difference of 0.14%), and Welsh (11.6%, a difference of 0.26%).
| Demographics | Rating | Rank | Poverty |
| Palestinians | 91.8 /100 | #107 | Exceptional 11.6% |
| Canadians | 91.7 /100 | #108 | Exceptional 11.6% |
| Immigrants | Turkey | 91.7 /100 | #109 | Exceptional 11.6% |
| Welsh | 91.6 /100 | #110 | Exceptional 11.6% |
| French Canadians | 91.0 /100 | #111 | Exceptional 11.6% |
| Immigrants | Southern Europe | 90.8 /100 | #112 | Exceptional 11.6% |
| Immigrants | Belarus | 90.8 /100 | #113 | Exceptional 11.6% |
| Immigrants | China | 90.7 /100 | #114 | Exceptional 11.6% |
| Albanians | 90.3 /100 | #115 | Exceptional 11.7% |
| Immigrants | Russia | 89.7 /100 | #116 | Excellent 11.7% |
| Sri Lankans | 89.4 /100 | #117 | Excellent 11.7% |
| Argentineans | 89.1 /100 | #118 | Excellent 11.7% |
| Tlingit-Haida | 89.0 /100 | #119 | Excellent 11.7% |
| Immigrants | South Eastern Asia | 88.9 /100 | #120 | Excellent 11.7% |
| New Zealanders | 88.7 /100 | #121 | Excellent 11.7% |
Demographics Similar to Shoshone by Poverty
In terms of poverty, the demographic groups most similar to Shoshone are Chickasaw (14.7%, a difference of 0.040%), Central American (14.6%, a difference of 0.58%), Spanish American (14.7%, a difference of 0.58%), Immigrants from Cuba (14.6%, a difference of 0.72%), and Subsaharan African (14.5%, a difference of 0.88%).
| Demographics | Rating | Rank | Poverty |
| Immigrants | Jamaica | 0.1 /100 | #264 | Tragic 14.4% |
| Immigrants | Guyana | 0.1 /100 | #265 | Tragic 14.5% |
| Guyanese | 0.1 /100 | #266 | Tragic 14.5% |
| Iroquois | 0.1 /100 | #267 | Tragic 14.5% |
| Sub-Saharan Africans | 0.1 /100 | #268 | Tragic 14.5% |
| Immigrants | Cuba | 0.1 /100 | #269 | Tragic 14.6% |
| Central Americans | 0.1 /100 | #270 | Tragic 14.6% |
| Shoshone | 0.0 /100 | #271 | Tragic 14.7% |
| Chickasaw | 0.0 /100 | #272 | Tragic 14.7% |
| Spanish Americans | 0.0 /100 | #273 | Tragic 14.7% |
| Barbadians | 0.0 /100 | #274 | Tragic 14.8% |
| Immigrants | West Indies | 0.0 /100 | #275 | Tragic 14.8% |
| Immigrants | Bahamas | 0.0 /100 | #276 | Tragic 14.8% |
| Bangladeshis | 0.0 /100 | #277 | Tragic 14.8% |
| Belizeans | 0.0 /100 | #278 | Tragic 14.8% |