African vs Shoshone Poverty
COMPARE
African
Shoshone
Poverty
Poverty Comparison
Africans
Shoshone
15.6%
POVERTY
0.0/ 100
METRIC RATING
307th/ 347
METRIC RANK
14.7%
POVERTY
0.0/ 100
METRIC RATING
271st/ 347
METRIC RANK
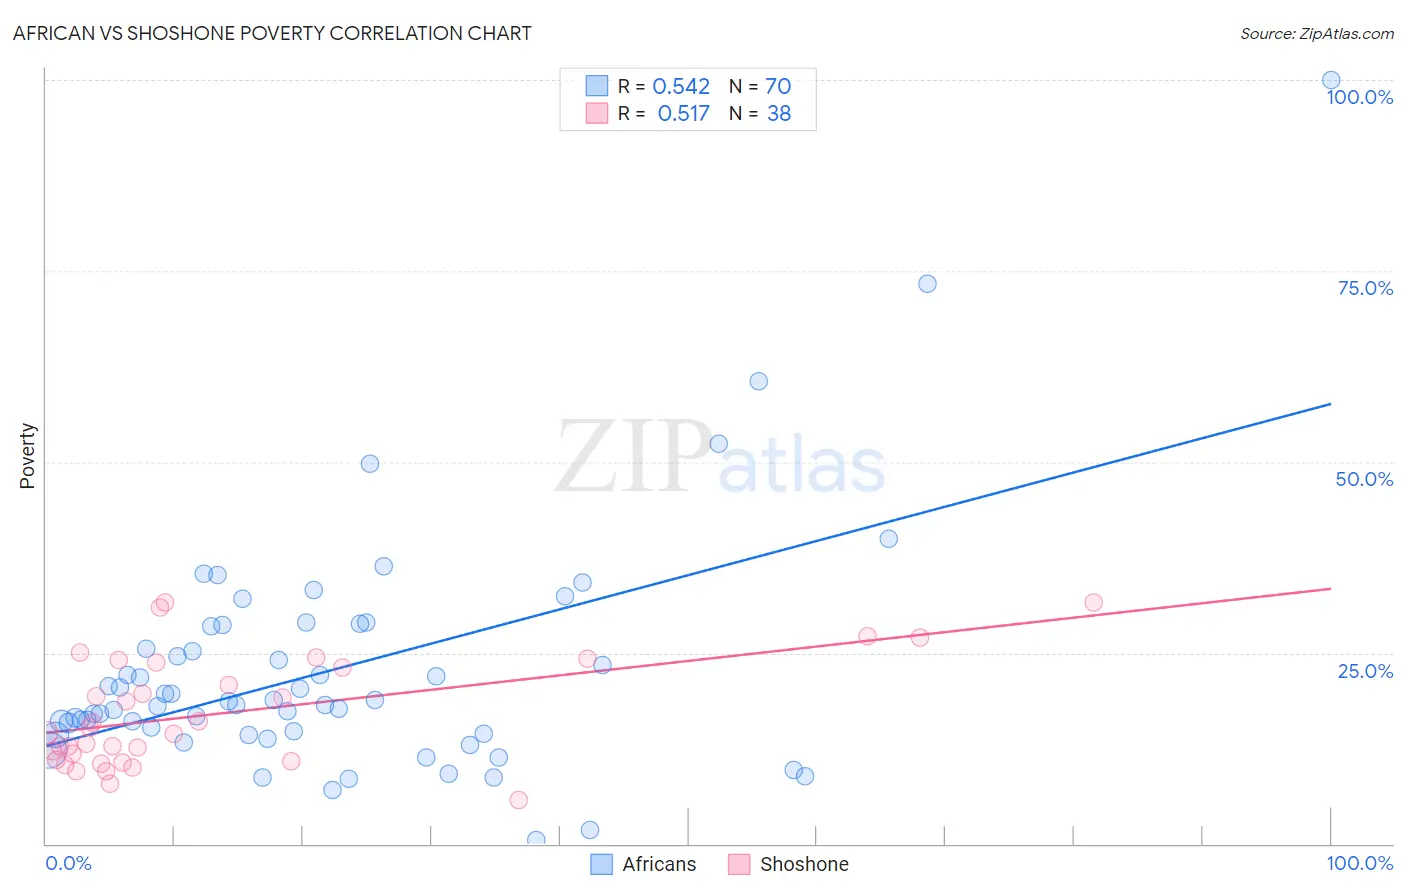
African vs Shoshone Poverty Correlation Chart
The statistical analysis conducted on geographies consisting of 469,617,855 people shows a substantial positive correlation between the proportion of Africans and poverty level in the United States with a correlation coefficient (R) of 0.542 and weighted average of 15.6%. Similarly, the statistical analysis conducted on geographies consisting of 66,616,342 people shows a substantial positive correlation between the proportion of Shoshone and poverty level in the United States with a correlation coefficient (R) of 0.517 and weighted average of 14.7%, a difference of 6.3%.
Poverty Correlation Summary
| Measurement | African | Shoshone |
| Minimum | 0.57% | 5.7% |
| Maximum | 100.0% | 31.5% |
| Range | 99.4% | 25.8% |
| Mean | 22.7% | 17.1% |
| Median | 18.4% | 14.9% |
| Interquartile 25% (IQ1) | 14.4% | 11.0% |
| Interquartile 75% (IQ3) | 28.5% | 23.8% |
| Interquartile Range (IQR) | 14.0% | 12.8% |
| Standard Deviation (Sample) | 15.6% | 7.1% |
| Standard Deviation (Population) | 15.5% | 7.0% |
Similar Demographics by Poverty
Demographics Similar to Africans by Poverty
In terms of poverty, the demographic groups most similar to Africans are Creek (15.6%, a difference of 0.070%), Choctaw (15.6%, a difference of 0.11%), Seminole (15.6%, a difference of 0.15%), Dutch West Indian (15.6%, a difference of 0.24%), and Immigrants from Guatemala (15.5%, a difference of 0.51%).
| Demographics | Rating | Rank | Poverty |
| Immigrants | Central America | 0.0 /100 | #300 | Tragic 15.4% |
| Bahamians | 0.0 /100 | #301 | Tragic 15.4% |
| Somalis | 0.0 /100 | #302 | Tragic 15.4% |
| Immigrants | Caribbean | 0.0 /100 | #303 | Tragic 15.5% |
| Immigrants | Mexico | 0.0 /100 | #304 | Tragic 15.5% |
| Immigrants | Guatemala | 0.0 /100 | #305 | Tragic 15.5% |
| Creek | 0.0 /100 | #306 | Tragic 15.6% |
| Africans | 0.0 /100 | #307 | Tragic 15.6% |
| Choctaw | 0.0 /100 | #308 | Tragic 15.6% |
| Seminole | 0.0 /100 | #309 | Tragic 15.6% |
| Dutch West Indians | 0.0 /100 | #310 | Tragic 15.6% |
| Chippewa | 0.0 /100 | #311 | Tragic 15.7% |
| Cajuns | 0.0 /100 | #312 | Tragic 15.7% |
| Immigrants | Grenada | 0.0 /100 | #313 | Tragic 15.8% |
| Immigrants | Somalia | 0.0 /100 | #314 | Tragic 15.8% |
Demographics Similar to Shoshone by Poverty
In terms of poverty, the demographic groups most similar to Shoshone are Chickasaw (14.7%, a difference of 0.040%), Central American (14.6%, a difference of 0.58%), Spanish American (14.7%, a difference of 0.58%), Immigrants from Cuba (14.6%, a difference of 0.72%), and Subsaharan African (14.5%, a difference of 0.88%).
| Demographics | Rating | Rank | Poverty |
| Immigrants | Jamaica | 0.1 /100 | #264 | Tragic 14.4% |
| Immigrants | Guyana | 0.1 /100 | #265 | Tragic 14.5% |
| Guyanese | 0.1 /100 | #266 | Tragic 14.5% |
| Iroquois | 0.1 /100 | #267 | Tragic 14.5% |
| Sub-Saharan Africans | 0.1 /100 | #268 | Tragic 14.5% |
| Immigrants | Cuba | 0.1 /100 | #269 | Tragic 14.6% |
| Central Americans | 0.1 /100 | #270 | Tragic 14.6% |
| Shoshone | 0.0 /100 | #271 | Tragic 14.7% |
| Chickasaw | 0.0 /100 | #272 | Tragic 14.7% |
| Spanish Americans | 0.0 /100 | #273 | Tragic 14.7% |
| Barbadians | 0.0 /100 | #274 | Tragic 14.8% |
| Immigrants | West Indies | 0.0 /100 | #275 | Tragic 14.8% |
| Immigrants | Bahamas | 0.0 /100 | #276 | Tragic 14.8% |
| Bangladeshis | 0.0 /100 | #277 | Tragic 14.8% |
| Belizeans | 0.0 /100 | #278 | Tragic 14.8% |