Immigrants from China vs Hispanic or Latino Poverty
COMPARE
Immigrants from China
Hispanic or Latino
Poverty
Poverty Comparison
Immigrants from China
Hispanics or Latinos
11.6%
POVERTY
90.7/ 100
METRIC RATING
114th/ 347
METRIC RANK
15.3%
POVERTY
0.0/ 100
METRIC RATING
296th/ 347
METRIC RANK
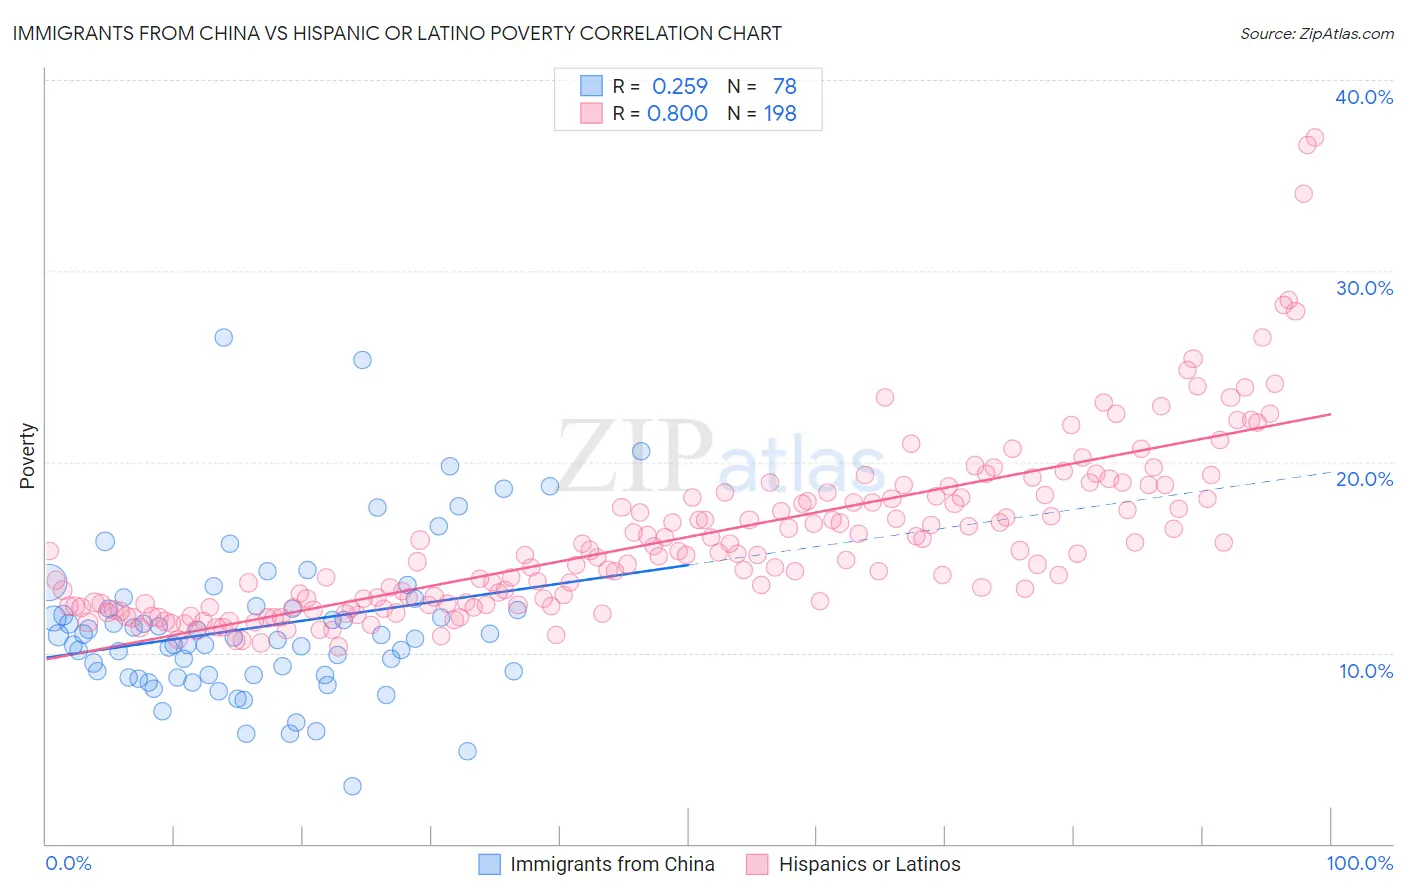
Immigrants from China vs Hispanic or Latino Poverty Correlation Chart
The statistical analysis conducted on geographies consisting of 456,587,979 people shows a weak positive correlation between the proportion of Immigrants from China and poverty level in the United States with a correlation coefficient (R) of 0.259 and weighted average of 11.6%. Similarly, the statistical analysis conducted on geographies consisting of 574,490,073 people shows a very strong positive correlation between the proportion of Hispanics or Latinos and poverty level in the United States with a correlation coefficient (R) of 0.800 and weighted average of 15.3%, a difference of 31.1%.
Poverty Correlation Summary
| Measurement | Immigrants from China | Hispanic or Latino |
| Minimum | 3.0% | 10.3% |
| Maximum | 26.5% | 37.0% |
| Range | 23.5% | 26.7% |
| Mean | 11.4% | 16.0% |
| Median | 10.8% | 15.1% |
| Interquartile 25% (IQ1) | 8.8% | 12.5% |
| Interquartile 75% (IQ3) | 12.3% | 18.1% |
| Interquartile Range (IQR) | 3.5% | 5.6% |
| Standard Deviation (Sample) | 4.1% | 4.6% |
| Standard Deviation (Population) | 4.1% | 4.6% |
Similar Demographics by Poverty
Demographics Similar to Immigrants from China by Poverty
In terms of poverty, the demographic groups most similar to Immigrants from China are Immigrants from Southern Europe (11.6%, a difference of 0.020%), Immigrants from Belarus (11.6%, a difference of 0.020%), French Canadian (11.6%, a difference of 0.090%), Albanian (11.7%, a difference of 0.14%), and Welsh (11.6%, a difference of 0.26%).
| Demographics | Rating | Rank | Poverty |
| Palestinians | 91.8 /100 | #107 | Exceptional 11.6% |
| Canadians | 91.7 /100 | #108 | Exceptional 11.6% |
| Immigrants | Turkey | 91.7 /100 | #109 | Exceptional 11.6% |
| Welsh | 91.6 /100 | #110 | Exceptional 11.6% |
| French Canadians | 91.0 /100 | #111 | Exceptional 11.6% |
| Immigrants | Southern Europe | 90.8 /100 | #112 | Exceptional 11.6% |
| Immigrants | Belarus | 90.8 /100 | #113 | Exceptional 11.6% |
| Immigrants | China | 90.7 /100 | #114 | Exceptional 11.6% |
| Albanians | 90.3 /100 | #115 | Exceptional 11.7% |
| Immigrants | Russia | 89.7 /100 | #116 | Excellent 11.7% |
| Sri Lankans | 89.4 /100 | #117 | Excellent 11.7% |
| Argentineans | 89.1 /100 | #118 | Excellent 11.7% |
| Tlingit-Haida | 89.0 /100 | #119 | Excellent 11.7% |
| Immigrants | South Eastern Asia | 88.9 /100 | #120 | Excellent 11.7% |
| New Zealanders | 88.7 /100 | #121 | Excellent 11.7% |
Demographics Similar to Hispanics or Latinos by Poverty
In terms of poverty, the demographic groups most similar to Hispanics or Latinos are Guatemalan (15.3%, a difference of 0.010%), Immigrants from Bangladesh (15.3%, a difference of 0.050%), Immigrants from Senegal (15.3%, a difference of 0.19%), Senegalese (15.3%, a difference of 0.29%), and Blackfeet (15.2%, a difference of 0.43%).
| Demographics | Rating | Rank | Poverty |
| Immigrants | Belize | 0.0 /100 | #289 | Tragic 15.1% |
| Mexicans | 0.0 /100 | #290 | Tragic 15.1% |
| Immigrants | Cabo Verde | 0.0 /100 | #291 | Tragic 15.1% |
| Indonesians | 0.0 /100 | #292 | Tragic 15.1% |
| Immigrants | Zaire | 0.0 /100 | #293 | Tragic 15.1% |
| Blackfeet | 0.0 /100 | #294 | Tragic 15.2% |
| Guatemalans | 0.0 /100 | #295 | Tragic 15.3% |
| Hispanics or Latinos | 0.0 /100 | #296 | Tragic 15.3% |
| Immigrants | Bangladesh | 0.0 /100 | #297 | Tragic 15.3% |
| Immigrants | Senegal | 0.0 /100 | #298 | Tragic 15.3% |
| Senegalese | 0.0 /100 | #299 | Tragic 15.3% |
| Immigrants | Central America | 0.0 /100 | #300 | Tragic 15.4% |
| Bahamians | 0.0 /100 | #301 | Tragic 15.4% |
| Somalis | 0.0 /100 | #302 | Tragic 15.4% |
| Immigrants | Caribbean | 0.0 /100 | #303 | Tragic 15.5% |