Immigrants from Greece vs Shoshone Poverty
COMPARE
Immigrants from Greece
Shoshone
Poverty
Poverty Comparison
Immigrants from Greece
Shoshone
10.8%
POVERTY
99.3/ 100
METRIC RATING
37th/ 347
METRIC RANK
14.7%
POVERTY
0.0/ 100
METRIC RATING
271st/ 347
METRIC RANK
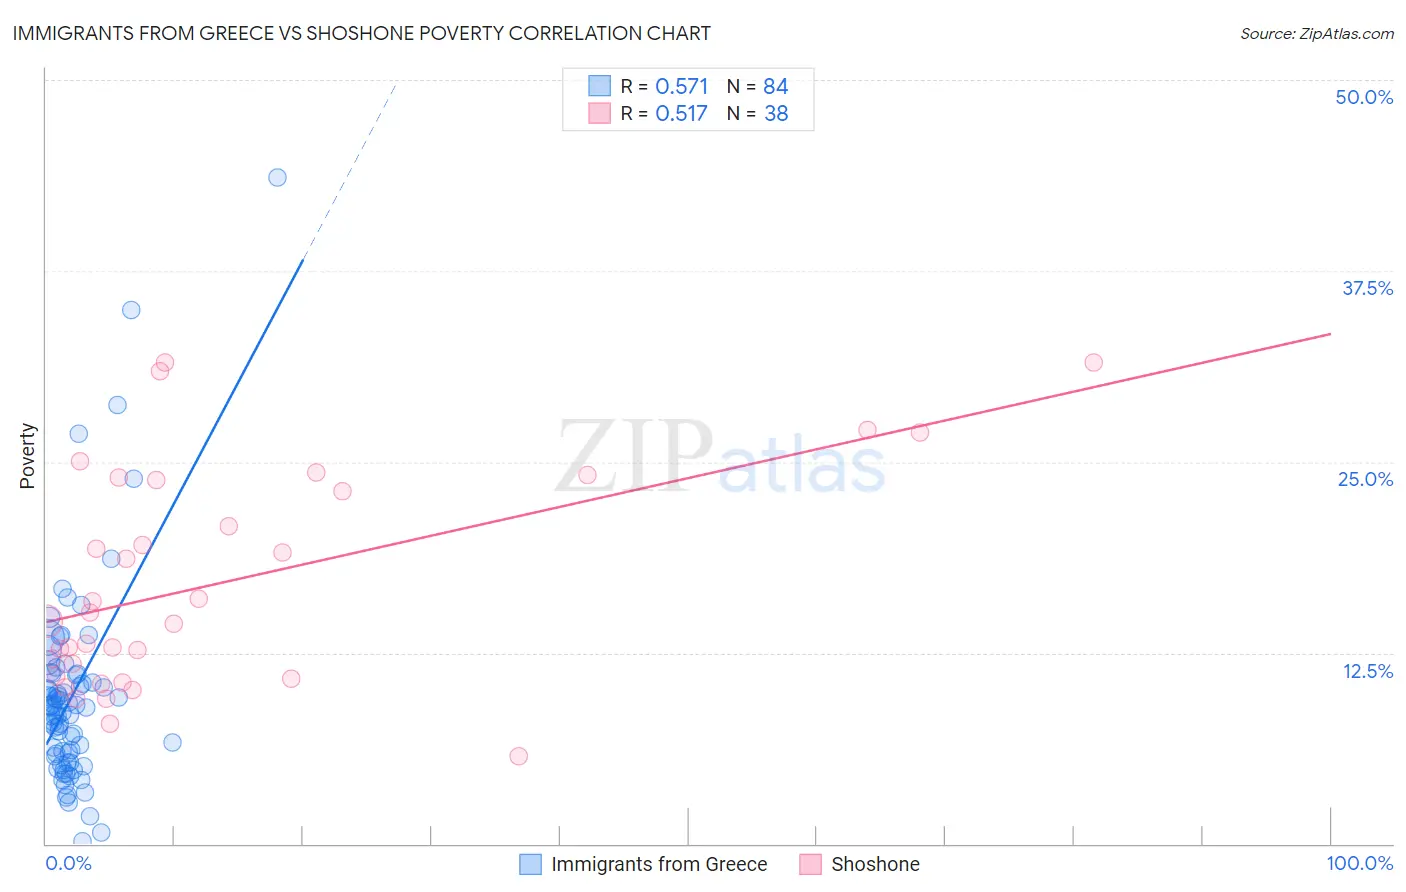
Immigrants from Greece vs Shoshone Poverty Correlation Chart
The statistical analysis conducted on geographies consisting of 216,856,400 people shows a substantial positive correlation between the proportion of Immigrants from Greece and poverty level in the United States with a correlation coefficient (R) of 0.571 and weighted average of 10.8%. Similarly, the statistical analysis conducted on geographies consisting of 66,616,342 people shows a substantial positive correlation between the proportion of Shoshone and poverty level in the United States with a correlation coefficient (R) of 0.517 and weighted average of 14.7%, a difference of 35.3%.
Poverty Correlation Summary
| Measurement | Immigrants from Greece | Shoshone |
| Minimum | 0.19% | 5.7% |
| Maximum | 43.6% | 31.5% |
| Range | 43.4% | 25.8% |
| Mean | 9.7% | 17.1% |
| Median | 8.9% | 14.9% |
| Interquartile 25% (IQ1) | 5.8% | 11.0% |
| Interquartile 75% (IQ3) | 11.1% | 23.8% |
| Interquartile Range (IQR) | 5.3% | 12.8% |
| Standard Deviation (Sample) | 6.8% | 7.1% |
| Standard Deviation (Population) | 6.8% | 7.0% |
Similar Demographics by Poverty
Demographics Similar to Immigrants from Greece by Poverty
In terms of poverty, the demographic groups most similar to Immigrants from Greece are Czech (10.8%, a difference of 0.050%), Cypriot (10.8%, a difference of 0.10%), Immigrants from Pakistan (10.8%, a difference of 0.13%), Tongan (10.8%, a difference of 0.17%), and Russian (10.9%, a difference of 0.18%).
| Demographics | Rating | Rank | Poverty |
| Danes | 99.5 /100 | #30 | Exceptional 10.7% |
| Poles | 99.5 /100 | #31 | Exceptional 10.7% |
| Iranians | 99.5 /100 | #32 | Exceptional 10.7% |
| Macedonians | 99.4 /100 | #33 | Exceptional 10.8% |
| Immigrants | Poland | 99.4 /100 | #34 | Exceptional 10.8% |
| Tongans | 99.4 /100 | #35 | Exceptional 10.8% |
| Cypriots | 99.3 /100 | #36 | Exceptional 10.8% |
| Immigrants | Greece | 99.3 /100 | #37 | Exceptional 10.8% |
| Czechs | 99.3 /100 | #38 | Exceptional 10.8% |
| Immigrants | Pakistan | 99.3 /100 | #39 | Exceptional 10.8% |
| Russians | 99.3 /100 | #40 | Exceptional 10.9% |
| Immigrants | Iran | 99.2 /100 | #41 | Exceptional 10.9% |
| Koreans | 99.2 /100 | #42 | Exceptional 10.9% |
| Immigrants | Singapore | 99.2 /100 | #43 | Exceptional 10.9% |
| Immigrants | Moldova | 99.1 /100 | #44 | Exceptional 10.9% |
Demographics Similar to Shoshone by Poverty
In terms of poverty, the demographic groups most similar to Shoshone are Chickasaw (14.7%, a difference of 0.040%), Central American (14.6%, a difference of 0.58%), Spanish American (14.7%, a difference of 0.58%), Immigrants from Cuba (14.6%, a difference of 0.72%), and Subsaharan African (14.5%, a difference of 0.88%).
| Demographics | Rating | Rank | Poverty |
| Immigrants | Jamaica | 0.1 /100 | #264 | Tragic 14.4% |
| Immigrants | Guyana | 0.1 /100 | #265 | Tragic 14.5% |
| Guyanese | 0.1 /100 | #266 | Tragic 14.5% |
| Iroquois | 0.1 /100 | #267 | Tragic 14.5% |
| Sub-Saharan Africans | 0.1 /100 | #268 | Tragic 14.5% |
| Immigrants | Cuba | 0.1 /100 | #269 | Tragic 14.6% |
| Central Americans | 0.1 /100 | #270 | Tragic 14.6% |
| Shoshone | 0.0 /100 | #271 | Tragic 14.7% |
| Chickasaw | 0.0 /100 | #272 | Tragic 14.7% |
| Spanish Americans | 0.0 /100 | #273 | Tragic 14.7% |
| Barbadians | 0.0 /100 | #274 | Tragic 14.8% |
| Immigrants | West Indies | 0.0 /100 | #275 | Tragic 14.8% |
| Immigrants | Bahamas | 0.0 /100 | #276 | Tragic 14.8% |
| Bangladeshis | 0.0 /100 | #277 | Tragic 14.8% |
| Belizeans | 0.0 /100 | #278 | Tragic 14.8% |