Immigrants from China vs Russian Poverty
COMPARE
Immigrants from China
Russian
Poverty
Poverty Comparison
Immigrants from China
Russians
11.6%
POVERTY
90.7/ 100
METRIC RATING
114th/ 347
METRIC RANK
10.9%
POVERTY
99.3/ 100
METRIC RATING
40th/ 347
METRIC RANK
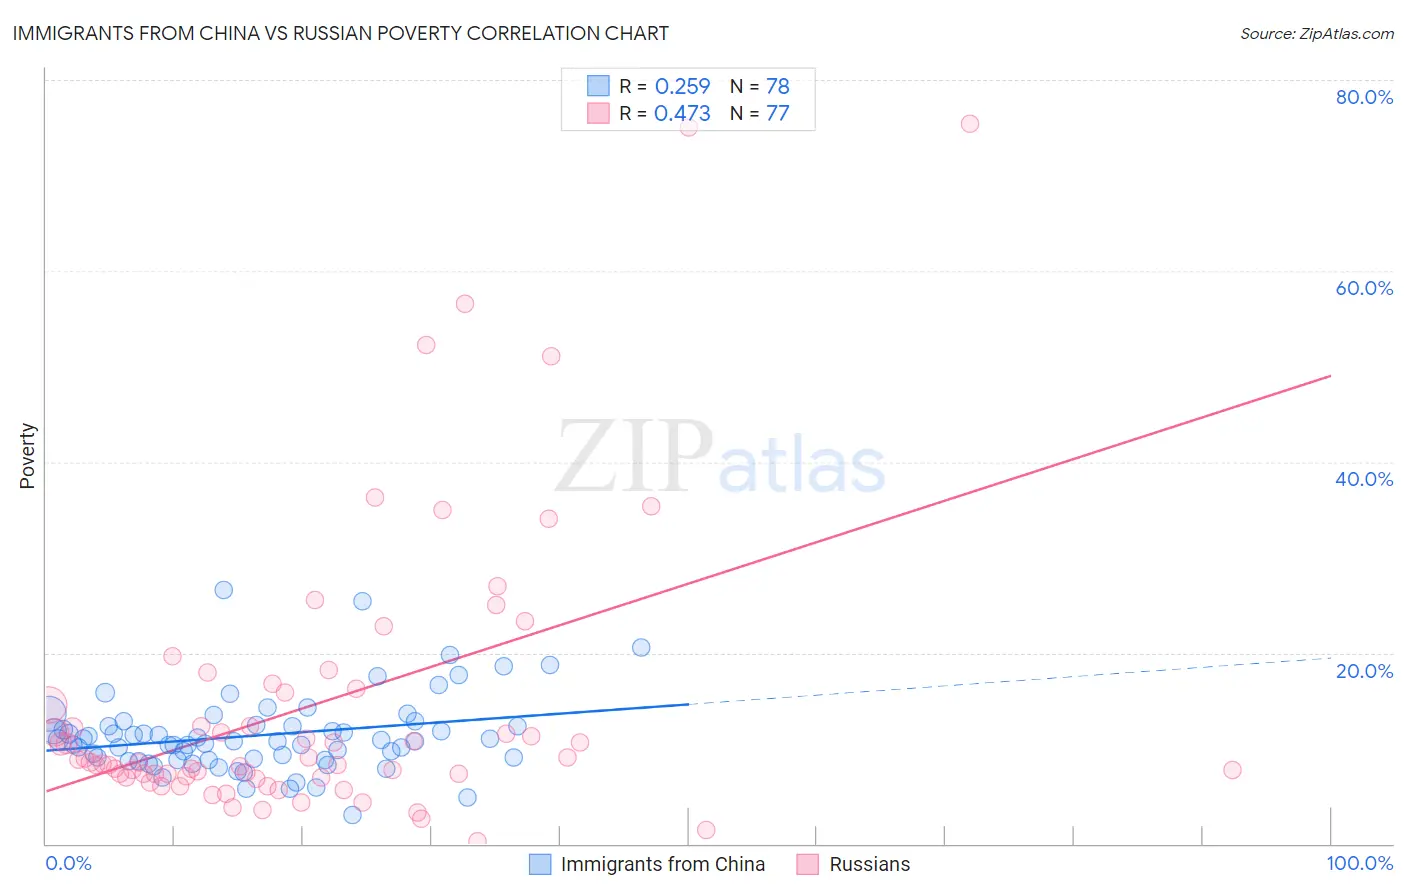
Immigrants from China vs Russian Poverty Correlation Chart
The statistical analysis conducted on geographies consisting of 456,587,979 people shows a weak positive correlation between the proportion of Immigrants from China and poverty level in the United States with a correlation coefficient (R) of 0.259 and weighted average of 11.6%. Similarly, the statistical analysis conducted on geographies consisting of 511,663,419 people shows a moderate positive correlation between the proportion of Russians and poverty level in the United States with a correlation coefficient (R) of 0.473 and weighted average of 10.9%, a difference of 7.2%.
Poverty Correlation Summary
| Measurement | Immigrants from China | Russian |
| Minimum | 3.0% | 0.31% |
| Maximum | 26.5% | 75.4% |
| Range | 23.5% | 75.1% |
| Mean | 11.4% | 14.6% |
| Median | 10.8% | 8.6% |
| Interquartile 25% (IQ1) | 8.8% | 7.0% |
| Interquartile 75% (IQ3) | 12.3% | 16.1% |
| Interquartile Range (IQR) | 3.5% | 9.1% |
| Standard Deviation (Sample) | 4.1% | 15.1% |
| Standard Deviation (Population) | 4.1% | 15.0% |
Similar Demographics by Poverty
Demographics Similar to Immigrants from China by Poverty
In terms of poverty, the demographic groups most similar to Immigrants from China are Immigrants from Southern Europe (11.6%, a difference of 0.020%), Immigrants from Belarus (11.6%, a difference of 0.020%), French Canadian (11.6%, a difference of 0.090%), Albanian (11.7%, a difference of 0.14%), and Welsh (11.6%, a difference of 0.26%).
| Demographics | Rating | Rank | Poverty |
| Palestinians | 91.8 /100 | #107 | Exceptional 11.6% |
| Canadians | 91.7 /100 | #108 | Exceptional 11.6% |
| Immigrants | Turkey | 91.7 /100 | #109 | Exceptional 11.6% |
| Welsh | 91.6 /100 | #110 | Exceptional 11.6% |
| French Canadians | 91.0 /100 | #111 | Exceptional 11.6% |
| Immigrants | Southern Europe | 90.8 /100 | #112 | Exceptional 11.6% |
| Immigrants | Belarus | 90.8 /100 | #113 | Exceptional 11.6% |
| Immigrants | China | 90.7 /100 | #114 | Exceptional 11.6% |
| Albanians | 90.3 /100 | #115 | Exceptional 11.7% |
| Immigrants | Russia | 89.7 /100 | #116 | Excellent 11.7% |
| Sri Lankans | 89.4 /100 | #117 | Excellent 11.7% |
| Argentineans | 89.1 /100 | #118 | Excellent 11.7% |
| Tlingit-Haida | 89.0 /100 | #119 | Excellent 11.7% |
| Immigrants | South Eastern Asia | 88.9 /100 | #120 | Excellent 11.7% |
| New Zealanders | 88.7 /100 | #121 | Excellent 11.7% |
Demographics Similar to Russians by Poverty
In terms of poverty, the demographic groups most similar to Russians are Immigrants from Pakistan (10.8%, a difference of 0.050%), Immigrants from Iran (10.9%, a difference of 0.090%), Czech (10.8%, a difference of 0.13%), Immigrants from Greece (10.8%, a difference of 0.18%), and Cypriot (10.8%, a difference of 0.27%).
| Demographics | Rating | Rank | Poverty |
| Macedonians | 99.4 /100 | #33 | Exceptional 10.8% |
| Immigrants | Poland | 99.4 /100 | #34 | Exceptional 10.8% |
| Tongans | 99.4 /100 | #35 | Exceptional 10.8% |
| Cypriots | 99.3 /100 | #36 | Exceptional 10.8% |
| Immigrants | Greece | 99.3 /100 | #37 | Exceptional 10.8% |
| Czechs | 99.3 /100 | #38 | Exceptional 10.8% |
| Immigrants | Pakistan | 99.3 /100 | #39 | Exceptional 10.8% |
| Russians | 99.3 /100 | #40 | Exceptional 10.9% |
| Immigrants | Iran | 99.2 /100 | #41 | Exceptional 10.9% |
| Koreans | 99.2 /100 | #42 | Exceptional 10.9% |
| Immigrants | Singapore | 99.2 /100 | #43 | Exceptional 10.9% |
| Immigrants | Moldova | 99.1 /100 | #44 | Exceptional 10.9% |
| Turks | 98.9 /100 | #45 | Exceptional 11.0% |
| Immigrants | Czechoslovakia | 98.9 /100 | #46 | Exceptional 11.0% |
| Immigrants | Romania | 98.9 /100 | #47 | Exceptional 11.0% |