Immigrants from China vs Mexican American Indian Poverty
COMPARE
Immigrants from China
Mexican American Indian
Poverty
Poverty Comparison
Immigrants from China
Mexican American Indians
11.6%
POVERTY
90.7/ 100
METRIC RATING
114th/ 347
METRIC RANK
14.3%
POVERTY
0.1/ 100
METRIC RATING
256th/ 347
METRIC RANK
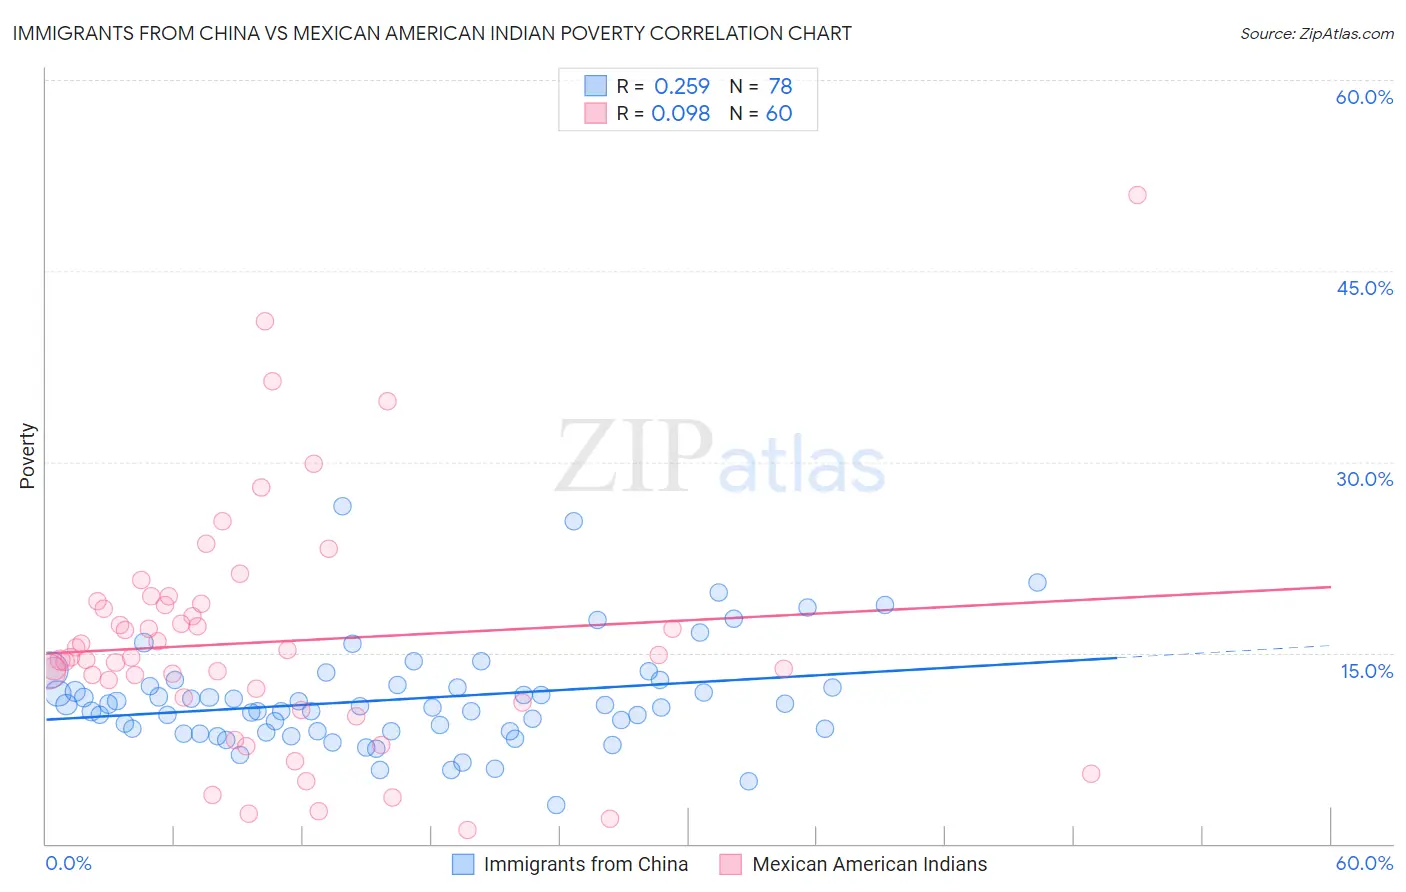
Immigrants from China vs Mexican American Indian Poverty Correlation Chart
The statistical analysis conducted on geographies consisting of 456,587,979 people shows a weak positive correlation between the proportion of Immigrants from China and poverty level in the United States with a correlation coefficient (R) of 0.259 and weighted average of 11.6%. Similarly, the statistical analysis conducted on geographies consisting of 317,505,642 people shows a slight positive correlation between the proportion of Mexican American Indians and poverty level in the United States with a correlation coefficient (R) of 0.098 and weighted average of 14.3%, a difference of 22.8%.
Poverty Correlation Summary
| Measurement | Immigrants from China | Mexican American Indian |
| Minimum | 3.0% | 1.1% |
| Maximum | 26.5% | 51.0% |
| Range | 23.5% | 49.9% |
| Mean | 11.4% | 15.9% |
| Median | 10.8% | 14.6% |
| Interquartile 25% (IQ1) | 8.8% | 11.3% |
| Interquartile 75% (IQ3) | 12.3% | 18.8% |
| Interquartile Range (IQR) | 3.5% | 7.5% |
| Standard Deviation (Sample) | 4.1% | 9.3% |
| Standard Deviation (Population) | 4.1% | 9.2% |
Similar Demographics by Poverty
Demographics Similar to Immigrants from China by Poverty
In terms of poverty, the demographic groups most similar to Immigrants from China are Immigrants from Southern Europe (11.6%, a difference of 0.020%), Immigrants from Belarus (11.6%, a difference of 0.020%), French Canadian (11.6%, a difference of 0.090%), Albanian (11.7%, a difference of 0.14%), and Welsh (11.6%, a difference of 0.26%).
| Demographics | Rating | Rank | Poverty |
| Palestinians | 91.8 /100 | #107 | Exceptional 11.6% |
| Canadians | 91.7 /100 | #108 | Exceptional 11.6% |
| Immigrants | Turkey | 91.7 /100 | #109 | Exceptional 11.6% |
| Welsh | 91.6 /100 | #110 | Exceptional 11.6% |
| French Canadians | 91.0 /100 | #111 | Exceptional 11.6% |
| Immigrants | Southern Europe | 90.8 /100 | #112 | Exceptional 11.6% |
| Immigrants | Belarus | 90.8 /100 | #113 | Exceptional 11.6% |
| Immigrants | China | 90.7 /100 | #114 | Exceptional 11.6% |
| Albanians | 90.3 /100 | #115 | Exceptional 11.7% |
| Immigrants | Russia | 89.7 /100 | #116 | Excellent 11.7% |
| Sri Lankans | 89.4 /100 | #117 | Excellent 11.7% |
| Argentineans | 89.1 /100 | #118 | Excellent 11.7% |
| Tlingit-Haida | 89.0 /100 | #119 | Excellent 11.7% |
| Immigrants | South Eastern Asia | 88.9 /100 | #120 | Excellent 11.7% |
| New Zealanders | 88.7 /100 | #121 | Excellent 11.7% |
Demographics Similar to Mexican American Indians by Poverty
In terms of poverty, the demographic groups most similar to Mexican American Indians are Immigrants from Ecuador (14.3%, a difference of 0.020%), Trinidadian and Tobagonian (14.3%, a difference of 0.040%), Ottawa (14.3%, a difference of 0.050%), Immigrants from El Salvador (14.3%, a difference of 0.11%), and Immigrants from Nicaragua (14.3%, a difference of 0.32%).
| Demographics | Rating | Rank | Poverty |
| Immigrants | Ghana | 0.2 /100 | #249 | Tragic 14.2% |
| Cree | 0.2 /100 | #250 | Tragic 14.2% |
| Immigrants | Burma/Myanmar | 0.2 /100 | #251 | Tragic 14.2% |
| Spanish American Indians | 0.2 /100 | #252 | Tragic 14.2% |
| Immigrants | Trinidad and Tobago | 0.2 /100 | #253 | Tragic 14.2% |
| Immigrants | El Salvador | 0.1 /100 | #254 | Tragic 14.3% |
| Immigrants | Ecuador | 0.1 /100 | #255 | Tragic 14.3% |
| Mexican American Indians | 0.1 /100 | #256 | Tragic 14.3% |
| Trinidadians and Tobagonians | 0.1 /100 | #257 | Tragic 14.3% |
| Ottawa | 0.1 /100 | #258 | Tragic 14.3% |
| Immigrants | Nicaragua | 0.1 /100 | #259 | Tragic 14.3% |
| Cape Verdeans | 0.1 /100 | #260 | Tragic 14.4% |
| Cherokee | 0.1 /100 | #261 | Tragic 14.4% |
| Immigrants | Liberia | 0.1 /100 | #262 | Tragic 14.4% |
| Jamaicans | 0.1 /100 | #263 | Tragic 14.4% |