Immigrants from Eritrea vs Immigrants from Nigeria Poverty
COMPARE
Immigrants from Eritrea
Immigrants from Nigeria
Poverty
Poverty Comparison
Immigrants from Eritrea
Immigrants from Nigeria
13.4%
POVERTY
2.4/ 100
METRIC RATING
224th/ 347
METRIC RANK
13.5%
POVERTY
1.7/ 100
METRIC RATING
228th/ 347
METRIC RANK
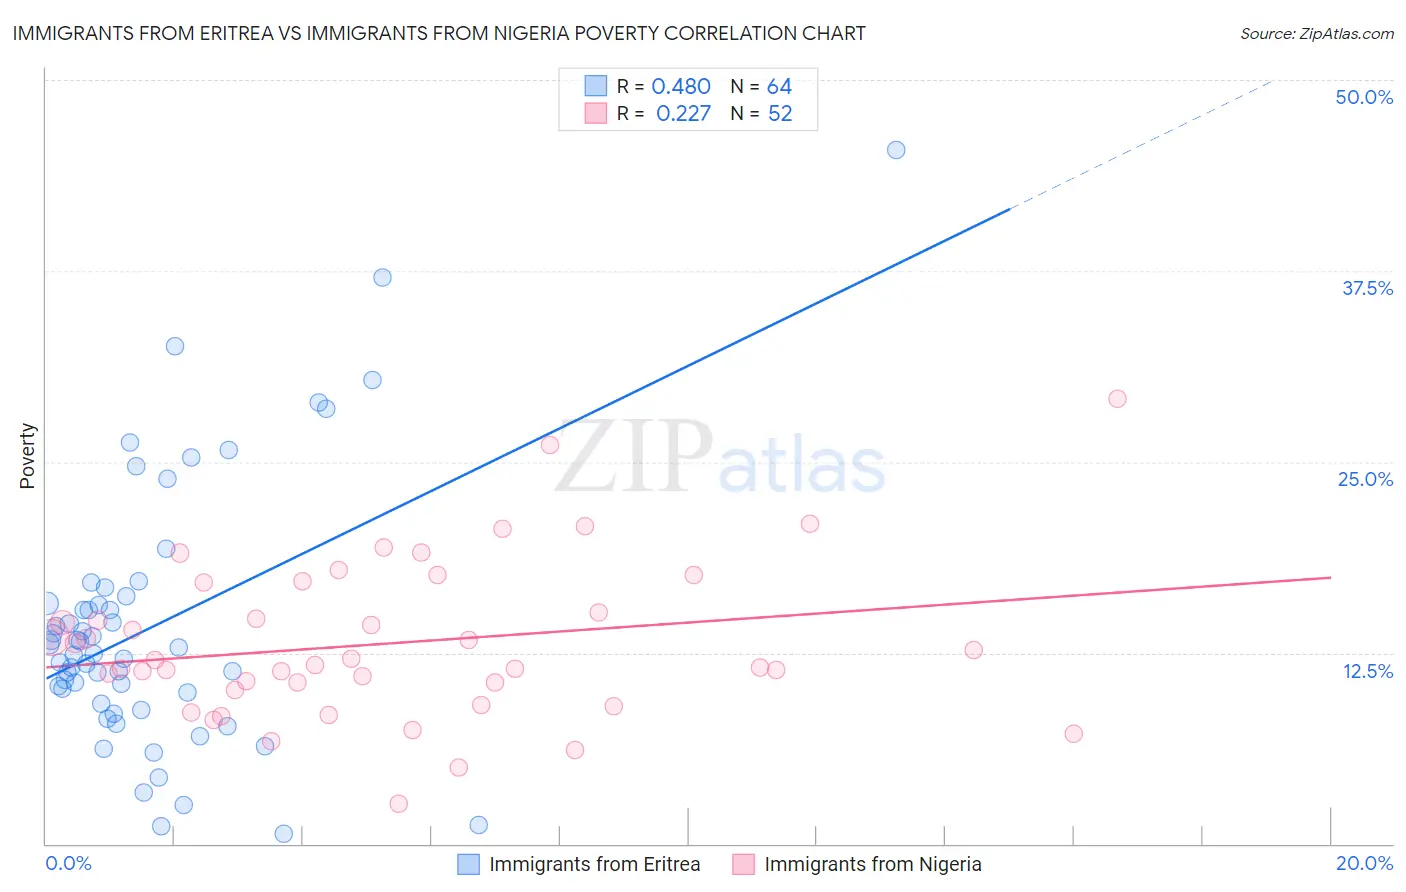
Immigrants from Eritrea vs Immigrants from Nigeria Poverty Correlation Chart
The statistical analysis conducted on geographies consisting of 104,846,826 people shows a moderate positive correlation between the proportion of Immigrants from Eritrea and poverty level in the United States with a correlation coefficient (R) of 0.480 and weighted average of 13.4%. Similarly, the statistical analysis conducted on geographies consisting of 283,297,538 people shows a weak positive correlation between the proportion of Immigrants from Nigeria and poverty level in the United States with a correlation coefficient (R) of 0.227 and weighted average of 13.5%, a difference of 0.83%.
Poverty Correlation Summary
| Measurement | Immigrants from Eritrea | Immigrants from Nigeria |
| Minimum | 0.62% | 2.6% |
| Maximum | 45.5% | 29.2% |
| Range | 44.8% | 26.5% |
| Mean | 14.2% | 13.1% |
| Median | 12.6% | 11.9% |
| Interquartile 25% (IQ1) | 9.5% | 10.3% |
| Interquartile 75% (IQ3) | 16.0% | 16.1% |
| Interquartile Range (IQR) | 6.4% | 5.8% |
| Standard Deviation (Sample) | 8.6% | 5.1% |
| Standard Deviation (Population) | 8.5% | 5.1% |
Demographics Similar to Immigrants from Eritrea and Immigrants from Nigeria by Poverty
In terms of poverty, the demographic groups most similar to Immigrants from Eritrea are Immigrants from Africa (13.4%, a difference of 0.10%), Immigrants from Micronesia (13.4%, a difference of 0.14%), Alsatian (13.4%, a difference of 0.18%), German Russian (13.4%, a difference of 0.22%), and Marshallese (13.4%, a difference of 0.23%). Similarly, the demographic groups most similar to Immigrants from Nigeria are Osage (13.6%, a difference of 0.24%), Alaskan Athabascan (13.6%, a difference of 0.30%), Alaska Native (13.5%, a difference of 0.45%), Nigerian (13.6%, a difference of 0.46%), and Marshallese (13.4%, a difference of 0.60%).
| Demographics | Rating | Rank | Poverty |
| Immigrants | Nonimmigrants | 3.3 /100 | #216 | Tragic 13.3% |
| Immigrants | Uzbekistan | 3.2 /100 | #217 | Tragic 13.3% |
| Immigrants | Thailand | 3.1 /100 | #218 | Tragic 13.3% |
| Immigrants | Cambodia | 3.0 /100 | #219 | Tragic 13.4% |
| Americans | 2.9 /100 | #220 | Tragic 13.4% |
| Alsatians | 2.6 /100 | #221 | Tragic 13.4% |
| Immigrants | Micronesia | 2.6 /100 | #222 | Tragic 13.4% |
| Immigrants | Africa | 2.5 /100 | #223 | Tragic 13.4% |
| Immigrants | Eritrea | 2.4 /100 | #224 | Tragic 13.4% |
| German Russians | 2.2 /100 | #225 | Tragic 13.4% |
| Marshallese | 2.2 /100 | #226 | Tragic 13.4% |
| Alaska Natives | 2.1 /100 | #227 | Tragic 13.5% |
| Immigrants | Nigeria | 1.7 /100 | #228 | Tragic 13.5% |
| Osage | 1.5 /100 | #229 | Tragic 13.6% |
| Alaskan Athabascans | 1.5 /100 | #230 | Tragic 13.6% |
| Nigerians | 1.4 /100 | #231 | Tragic 13.6% |
| Fijians | 0.8 /100 | #232 | Tragic 13.7% |
| Immigrants | Saudi Arabia | 0.8 /100 | #233 | Tragic 13.8% |
| Immigrants | Laos | 0.7 /100 | #234 | Tragic 13.8% |
| Cubans | 0.6 /100 | #235 | Tragic 13.9% |
| Immigrants | Armenia | 0.5 /100 | #236 | Tragic 13.9% |