Immigrants from Uruguay vs Immigrants from Nigeria Poverty
COMPARE
Immigrants from Uruguay
Immigrants from Nigeria
Poverty
Poverty Comparison
Immigrants from Uruguay
Immigrants from Nigeria
12.8%
POVERTY
15.6/ 100
METRIC RATING
202nd/ 347
METRIC RANK
13.5%
POVERTY
1.7/ 100
METRIC RATING
228th/ 347
METRIC RANK
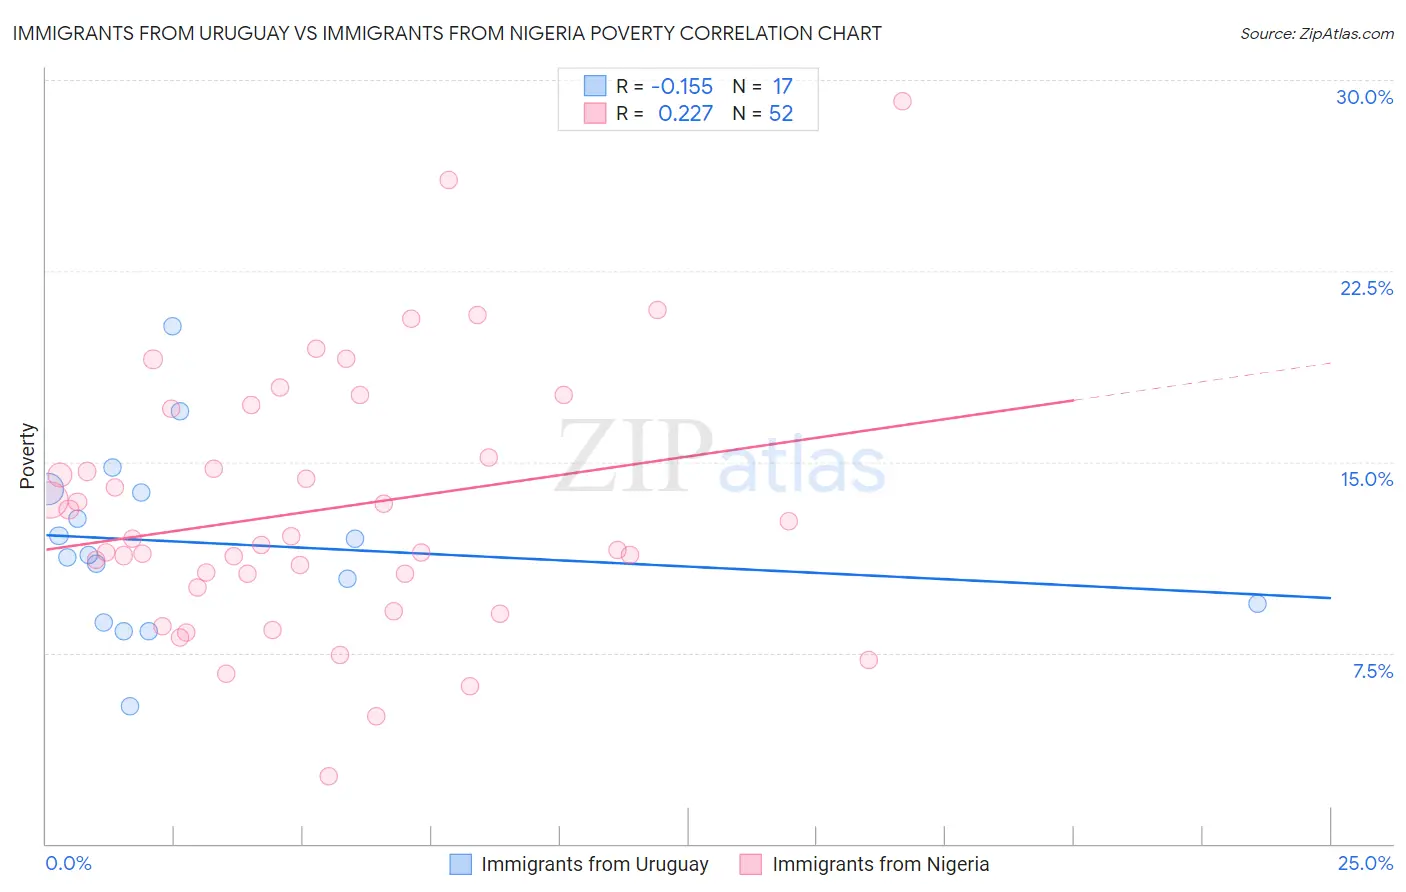
Immigrants from Uruguay vs Immigrants from Nigeria Poverty Correlation Chart
The statistical analysis conducted on geographies consisting of 133,245,054 people shows a poor negative correlation between the proportion of Immigrants from Uruguay and poverty level in the United States with a correlation coefficient (R) of -0.155 and weighted average of 12.8%. Similarly, the statistical analysis conducted on geographies consisting of 283,297,538 people shows a weak positive correlation between the proportion of Immigrants from Nigeria and poverty level in the United States with a correlation coefficient (R) of 0.227 and weighted average of 13.5%, a difference of 5.5%.
Poverty Correlation Summary
| Measurement | Immigrants from Uruguay | Immigrants from Nigeria |
| Minimum | 5.4% | 2.6% |
| Maximum | 20.3% | 29.2% |
| Range | 14.9% | 26.5% |
| Mean | 11.8% | 13.1% |
| Median | 11.4% | 11.9% |
| Interquartile 25% (IQ1) | 9.0% | 10.3% |
| Interquartile 75% (IQ3) | 13.9% | 16.1% |
| Interquartile Range (IQR) | 4.8% | 5.8% |
| Standard Deviation (Sample) | 3.5% | 5.1% |
| Standard Deviation (Population) | 3.4% | 5.1% |
Similar Demographics by Poverty
Demographics Similar to Immigrants from Uruguay by Poverty
In terms of poverty, the demographic groups most similar to Immigrants from Uruguay are Hmong (12.8%, a difference of 0.10%), Spaniard (12.8%, a difference of 0.16%), Immigrants from Uganda (12.8%, a difference of 0.16%), Immigrants from Western Asia (12.9%, a difference of 0.26%), and Immigrants from Kenya (12.8%, a difference of 0.32%).
| Demographics | Rating | Rank | Poverty |
| Immigrants | Kuwait | 20.9 /100 | #195 | Fair 12.7% |
| Iraqis | 20.8 /100 | #196 | Fair 12.7% |
| Immigrants | Lebanon | 18.7 /100 | #197 | Poor 12.8% |
| Spanish | 18.7 /100 | #198 | Poor 12.8% |
| Immigrants | Kenya | 17.5 /100 | #199 | Poor 12.8% |
| Spaniards | 16.5 /100 | #200 | Poor 12.8% |
| Immigrants | Uganda | 16.5 /100 | #201 | Poor 12.8% |
| Immigrants | Uruguay | 15.6 /100 | #202 | Poor 12.8% |
| Hmong | 15.0 /100 | #203 | Poor 12.8% |
| Immigrants | Western Asia | 14.1 /100 | #204 | Poor 12.9% |
| Tsimshian | 9.2 /100 | #205 | Tragic 13.0% |
| Immigrants | Eastern Africa | 7.0 /100 | #206 | Tragic 13.1% |
| Panamanians | 6.6 /100 | #207 | Tragic 13.1% |
| Ugandans | 6.2 /100 | #208 | Tragic 13.1% |
| Malaysians | 6.1 /100 | #209 | Tragic 13.1% |
Demographics Similar to Immigrants from Nigeria by Poverty
In terms of poverty, the demographic groups most similar to Immigrants from Nigeria are Osage (13.6%, a difference of 0.24%), Alaskan Athabascan (13.6%, a difference of 0.30%), Alaska Native (13.5%, a difference of 0.45%), Nigerian (13.6%, a difference of 0.46%), and Marshallese (13.4%, a difference of 0.60%).
| Demographics | Rating | Rank | Poverty |
| Alsatians | 2.6 /100 | #221 | Tragic 13.4% |
| Immigrants | Micronesia | 2.6 /100 | #222 | Tragic 13.4% |
| Immigrants | Africa | 2.5 /100 | #223 | Tragic 13.4% |
| Immigrants | Eritrea | 2.4 /100 | #224 | Tragic 13.4% |
| German Russians | 2.2 /100 | #225 | Tragic 13.4% |
| Marshallese | 2.2 /100 | #226 | Tragic 13.4% |
| Alaska Natives | 2.1 /100 | #227 | Tragic 13.5% |
| Immigrants | Nigeria | 1.7 /100 | #228 | Tragic 13.5% |
| Osage | 1.5 /100 | #229 | Tragic 13.6% |
| Alaskan Athabascans | 1.5 /100 | #230 | Tragic 13.6% |
| Nigerians | 1.4 /100 | #231 | Tragic 13.6% |
| Fijians | 0.8 /100 | #232 | Tragic 13.7% |
| Immigrants | Saudi Arabia | 0.8 /100 | #233 | Tragic 13.8% |
| Immigrants | Laos | 0.7 /100 | #234 | Tragic 13.8% |
| Cubans | 0.6 /100 | #235 | Tragic 13.9% |