Immigrants from Scotland vs Immigrants from Haiti Poverty
COMPARE
Immigrants from Scotland
Immigrants from Haiti
Poverty
Poverty Comparison
Immigrants from Scotland
Immigrants from Haiti
10.6%
POVERTY
99.7/ 100
METRIC RATING
19th/ 347
METRIC RANK
15.0%
POVERTY
0.0/ 100
METRIC RATING
283rd/ 347
METRIC RANK
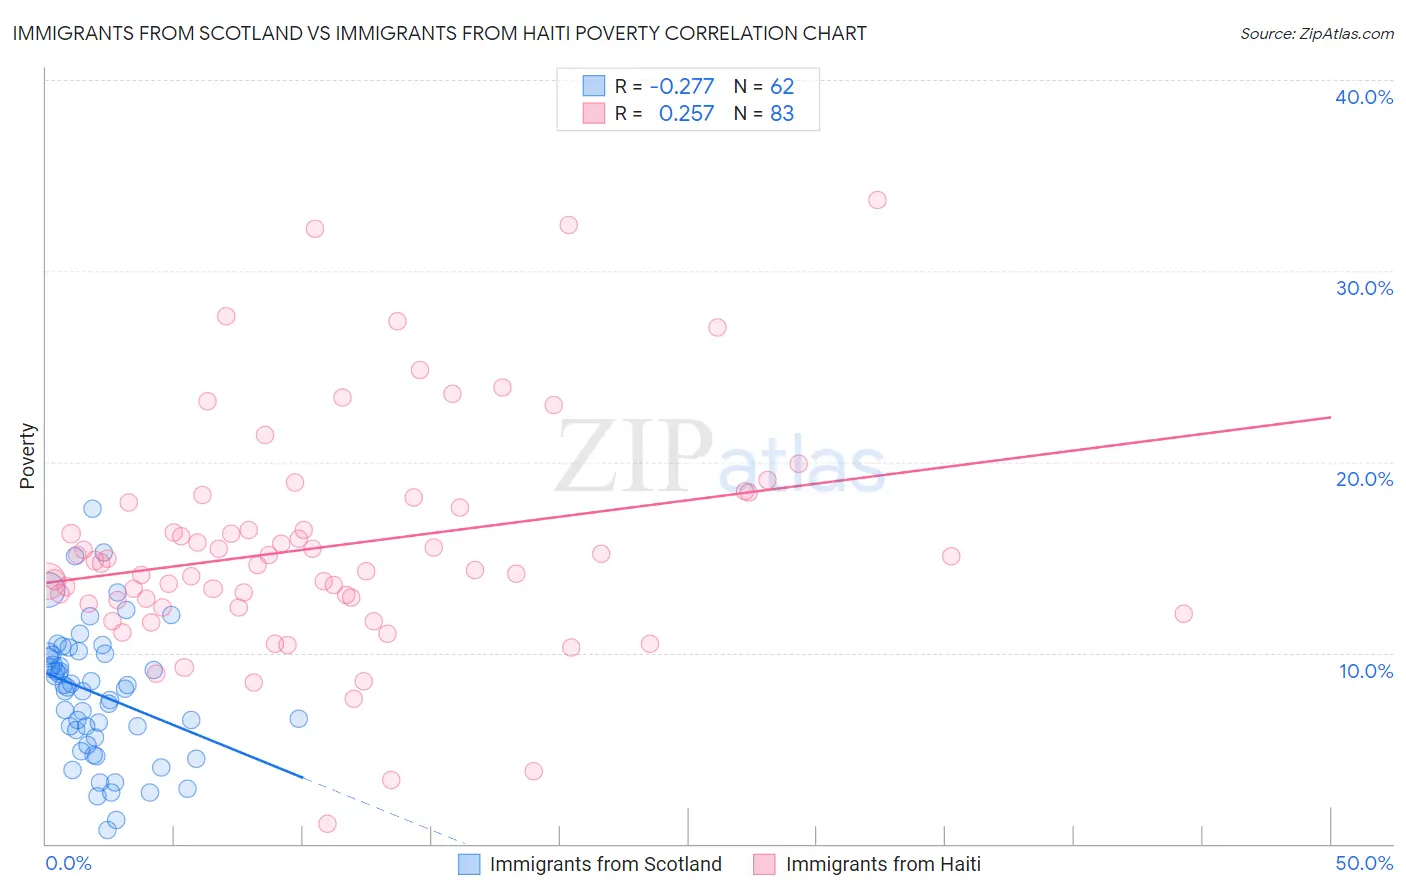
Immigrants from Scotland vs Immigrants from Haiti Poverty Correlation Chart
The statistical analysis conducted on geographies consisting of 196,384,756 people shows a weak negative correlation between the proportion of Immigrants from Scotland and poverty level in the United States with a correlation coefficient (R) of -0.277 and weighted average of 10.6%. Similarly, the statistical analysis conducted on geographies consisting of 225,178,584 people shows a weak positive correlation between the proportion of Immigrants from Haiti and poverty level in the United States with a correlation coefficient (R) of 0.257 and weighted average of 15.0%, a difference of 41.8%.
Poverty Correlation Summary
| Measurement | Immigrants from Scotland | Immigrants from Haiti |
| Minimum | 0.74% | 1.1% |
| Maximum | 17.6% | 33.7% |
| Range | 16.8% | 32.7% |
| Mean | 7.8% | 15.6% |
| Median | 8.2% | 14.7% |
| Interquartile 25% (IQ1) | 5.6% | 12.6% |
| Interquartile 75% (IQ3) | 9.9% | 17.9% |
| Interquartile Range (IQR) | 4.4% | 5.3% |
| Standard Deviation (Sample) | 3.5% | 5.9% |
| Standard Deviation (Population) | 3.4% | 5.9% |
Similar Demographics by Poverty
Demographics Similar to Immigrants from Scotland by Poverty
In terms of poverty, the demographic groups most similar to Immigrants from Scotland are Immigrants from North Macedonia (10.6%, a difference of 0.11%), Luxembourger (10.6%, a difference of 0.19%), Eastern European (10.6%, a difference of 0.35%), Latvian (10.5%, a difference of 0.39%), and Swedish (10.6%, a difference of 0.46%).
| Demographics | Rating | Rank | Poverty |
| Bhutanese | 99.8 /100 | #12 | Exceptional 10.4% |
| Immigrants | Hong Kong | 99.8 /100 | #13 | Exceptional 10.4% |
| Immigrants | Bolivia | 99.8 /100 | #14 | Exceptional 10.4% |
| Bolivians | 99.8 /100 | #15 | Exceptional 10.4% |
| Lithuanians | 99.8 /100 | #16 | Exceptional 10.5% |
| Norwegians | 99.8 /100 | #17 | Exceptional 10.5% |
| Latvians | 99.8 /100 | #18 | Exceptional 10.5% |
| Immigrants | Scotland | 99.7 /100 | #19 | Exceptional 10.6% |
| Immigrants | North Macedonia | 99.7 /100 | #20 | Exceptional 10.6% |
| Luxembourgers | 99.7 /100 | #21 | Exceptional 10.6% |
| Eastern Europeans | 99.7 /100 | #22 | Exceptional 10.6% |
| Swedes | 99.7 /100 | #23 | Exceptional 10.6% |
| Italians | 99.7 /100 | #24 | Exceptional 10.6% |
| Croatians | 99.6 /100 | #25 | Exceptional 10.6% |
| Burmese | 99.6 /100 | #26 | Exceptional 10.7% |
Demographics Similar to Immigrants from Haiti by Poverty
In terms of poverty, the demographic groups most similar to Immigrants from Haiti are West Indian (15.0%, a difference of 0.10%), Comanche (15.0%, a difference of 0.12%), Vietnamese (15.0%, a difference of 0.16%), Immigrants from Latin America (15.0%, a difference of 0.42%), and Immigrants from Barbados (14.9%, a difference of 0.45%).
| Demographics | Rating | Rank | Poverty |
| Immigrants | Bahamas | 0.0 /100 | #276 | Tragic 14.8% |
| Bangladeshis | 0.0 /100 | #277 | Tragic 14.8% |
| Belizeans | 0.0 /100 | #278 | Tragic 14.8% |
| Immigrants | St. Vincent and the Grenadines | 0.0 /100 | #279 | Tragic 14.9% |
| Haitians | 0.0 /100 | #280 | Tragic 14.9% |
| Immigrants | Barbados | 0.0 /100 | #281 | Tragic 14.9% |
| Comanche | 0.0 /100 | #282 | Tragic 15.0% |
| Immigrants | Haiti | 0.0 /100 | #283 | Tragic 15.0% |
| West Indians | 0.0 /100 | #284 | Tragic 15.0% |
| Vietnamese | 0.0 /100 | #285 | Tragic 15.0% |
| Immigrants | Latin America | 0.0 /100 | #286 | Tragic 15.0% |
| Inupiat | 0.0 /100 | #287 | Tragic 15.1% |
| Yaqui | 0.0 /100 | #288 | Tragic 15.1% |
| Immigrants | Belize | 0.0 /100 | #289 | Tragic 15.1% |
| Mexicans | 0.0 /100 | #290 | Tragic 15.1% |