Iranian vs Immigrants from Haiti Poverty
COMPARE
Iranian
Immigrants from Haiti
Poverty
Poverty Comparison
Iranians
Immigrants from Haiti
10.7%
POVERTY
99.5/ 100
METRIC RATING
32nd/ 347
METRIC RANK
15.0%
POVERTY
0.0/ 100
METRIC RATING
283rd/ 347
METRIC RANK
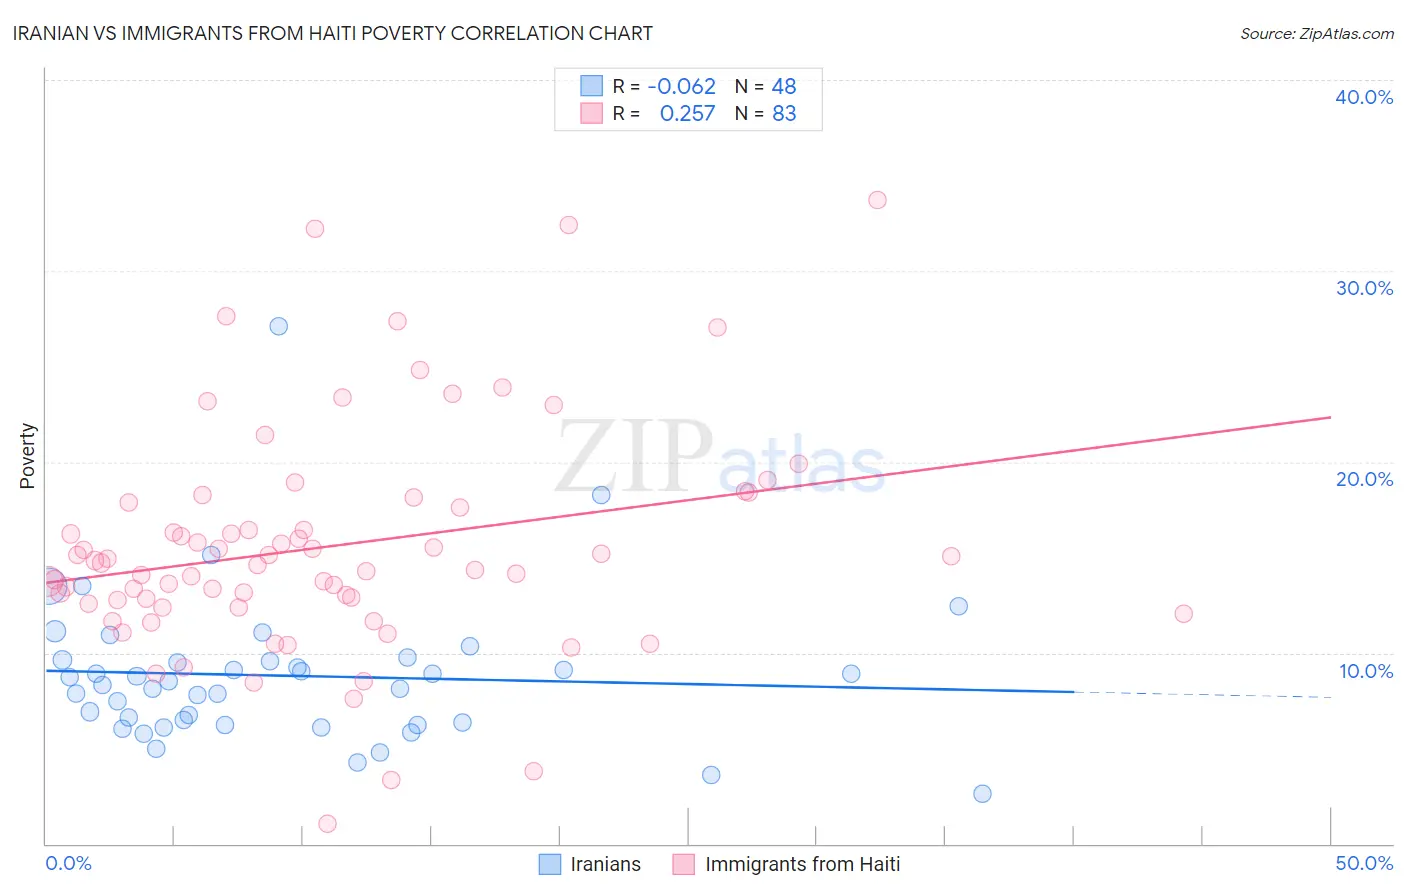
Iranian vs Immigrants from Haiti Poverty Correlation Chart
The statistical analysis conducted on geographies consisting of 316,670,706 people shows a slight negative correlation between the proportion of Iranians and poverty level in the United States with a correlation coefficient (R) of -0.062 and weighted average of 10.7%. Similarly, the statistical analysis conducted on geographies consisting of 225,178,584 people shows a weak positive correlation between the proportion of Immigrants from Haiti and poverty level in the United States with a correlation coefficient (R) of 0.257 and weighted average of 15.0%, a difference of 39.4%.
Poverty Correlation Summary
| Measurement | Iranian | Immigrants from Haiti |
| Minimum | 2.6% | 1.1% |
| Maximum | 27.1% | 33.7% |
| Range | 24.5% | 32.7% |
| Mean | 8.8% | 15.6% |
| Median | 8.4% | 14.7% |
| Interquartile 25% (IQ1) | 6.3% | 12.6% |
| Interquartile 75% (IQ3) | 9.6% | 17.9% |
| Interquartile Range (IQR) | 3.3% | 5.3% |
| Standard Deviation (Sample) | 4.0% | 5.9% |
| Standard Deviation (Population) | 3.9% | 5.9% |
Similar Demographics by Poverty
Demographics Similar to Iranians by Poverty
In terms of poverty, the demographic groups most similar to Iranians are Polish (10.7%, a difference of 0.090%), Danish (10.7%, a difference of 0.17%), Greek (10.7%, a difference of 0.18%), Immigrants from Korea (10.7%, a difference of 0.27%), and Immigrants from Northern Europe (10.7%, a difference of 0.34%).
| Demographics | Rating | Rank | Poverty |
| Croatians | 99.6 /100 | #25 | Exceptional 10.6% |
| Burmese | 99.6 /100 | #26 | Exceptional 10.7% |
| Immigrants | Northern Europe | 99.6 /100 | #27 | Exceptional 10.7% |
| Immigrants | Korea | 99.5 /100 | #28 | Exceptional 10.7% |
| Greeks | 99.5 /100 | #29 | Exceptional 10.7% |
| Danes | 99.5 /100 | #30 | Exceptional 10.7% |
| Poles | 99.5 /100 | #31 | Exceptional 10.7% |
| Iranians | 99.5 /100 | #32 | Exceptional 10.7% |
| Macedonians | 99.4 /100 | #33 | Exceptional 10.8% |
| Immigrants | Poland | 99.4 /100 | #34 | Exceptional 10.8% |
| Tongans | 99.4 /100 | #35 | Exceptional 10.8% |
| Cypriots | 99.3 /100 | #36 | Exceptional 10.8% |
| Immigrants | Greece | 99.3 /100 | #37 | Exceptional 10.8% |
| Czechs | 99.3 /100 | #38 | Exceptional 10.8% |
| Immigrants | Pakistan | 99.3 /100 | #39 | Exceptional 10.8% |
Demographics Similar to Immigrants from Haiti by Poverty
In terms of poverty, the demographic groups most similar to Immigrants from Haiti are West Indian (15.0%, a difference of 0.10%), Comanche (15.0%, a difference of 0.12%), Vietnamese (15.0%, a difference of 0.16%), Immigrants from Latin America (15.0%, a difference of 0.42%), and Immigrants from Barbados (14.9%, a difference of 0.45%).
| Demographics | Rating | Rank | Poverty |
| Immigrants | Bahamas | 0.0 /100 | #276 | Tragic 14.8% |
| Bangladeshis | 0.0 /100 | #277 | Tragic 14.8% |
| Belizeans | 0.0 /100 | #278 | Tragic 14.8% |
| Immigrants | St. Vincent and the Grenadines | 0.0 /100 | #279 | Tragic 14.9% |
| Haitians | 0.0 /100 | #280 | Tragic 14.9% |
| Immigrants | Barbados | 0.0 /100 | #281 | Tragic 14.9% |
| Comanche | 0.0 /100 | #282 | Tragic 15.0% |
| Immigrants | Haiti | 0.0 /100 | #283 | Tragic 15.0% |
| West Indians | 0.0 /100 | #284 | Tragic 15.0% |
| Vietnamese | 0.0 /100 | #285 | Tragic 15.0% |
| Immigrants | Latin America | 0.0 /100 | #286 | Tragic 15.0% |
| Inupiat | 0.0 /100 | #287 | Tragic 15.1% |
| Yaqui | 0.0 /100 | #288 | Tragic 15.1% |
| Immigrants | Belize | 0.0 /100 | #289 | Tragic 15.1% |
| Mexicans | 0.0 /100 | #290 | Tragic 15.1% |