Immigrants from Latvia vs Immigrants from Haiti Poverty
COMPARE
Immigrants from Latvia
Immigrants from Haiti
Poverty
Poverty Comparison
Immigrants from Latvia
Immigrants from Haiti
11.5%
POVERTY
94.5/ 100
METRIC RATING
98th/ 347
METRIC RANK
15.0%
POVERTY
0.0/ 100
METRIC RATING
283rd/ 347
METRIC RANK
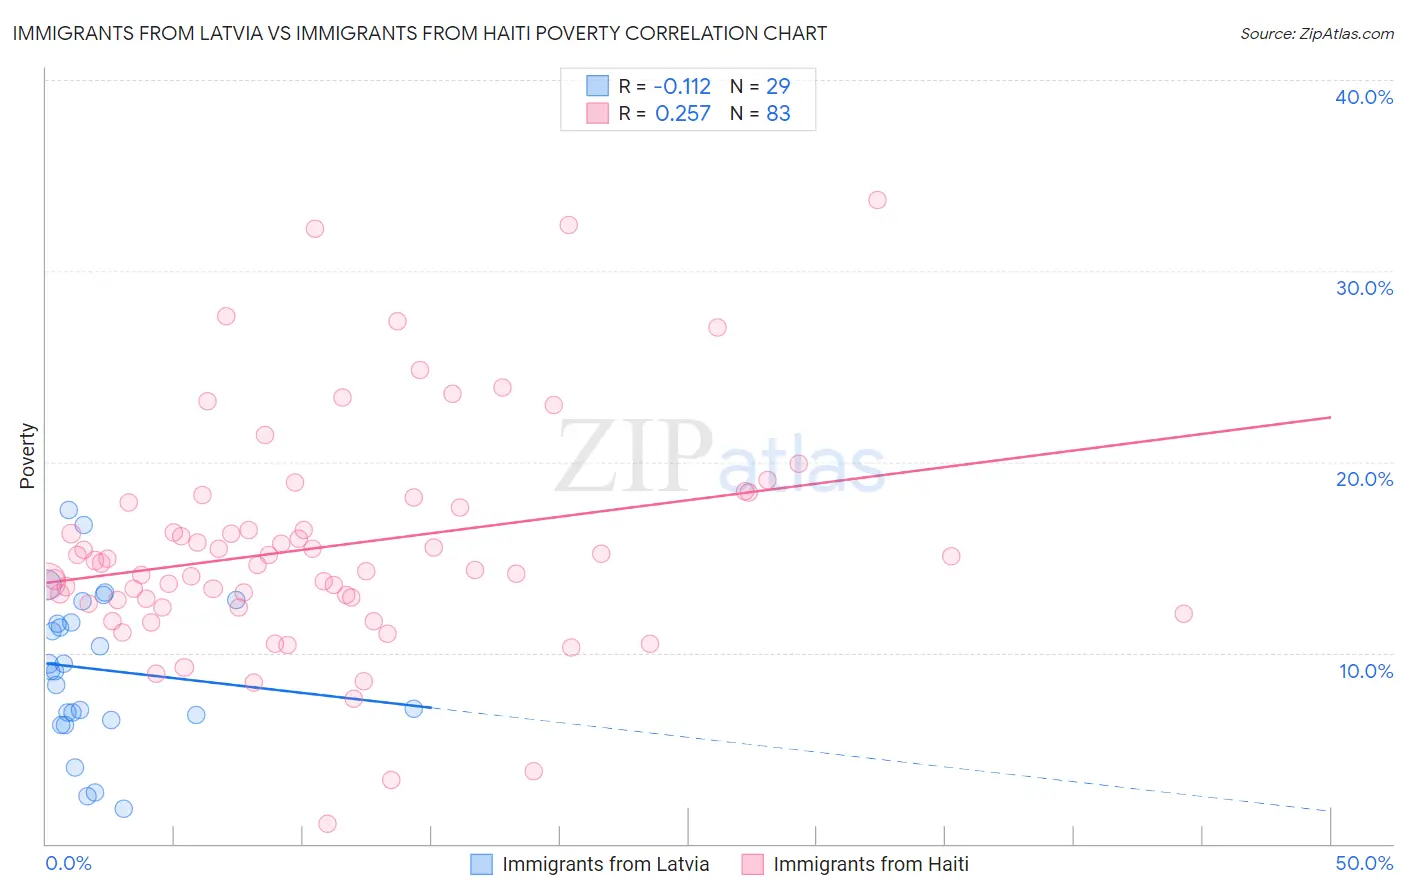
Immigrants from Latvia vs Immigrants from Haiti Poverty Correlation Chart
The statistical analysis conducted on geographies consisting of 113,731,697 people shows a poor negative correlation between the proportion of Immigrants from Latvia and poverty level in the United States with a correlation coefficient (R) of -0.112 and weighted average of 11.5%. Similarly, the statistical analysis conducted on geographies consisting of 225,178,584 people shows a weak positive correlation between the proportion of Immigrants from Haiti and poverty level in the United States with a correlation coefficient (R) of 0.257 and weighted average of 15.0%, a difference of 30.6%.
Poverty Correlation Summary
| Measurement | Immigrants from Latvia | Immigrants from Haiti |
| Minimum | 1.8% | 1.1% |
| Maximum | 17.5% | 33.7% |
| Range | 15.6% | 32.7% |
| Mean | 9.1% | 15.6% |
| Median | 9.1% | 14.7% |
| Interquartile 25% (IQ1) | 6.6% | 12.6% |
| Interquartile 75% (IQ3) | 12.2% | 17.9% |
| Interquartile Range (IQR) | 5.6% | 5.3% |
| Standard Deviation (Sample) | 4.0% | 5.9% |
| Standard Deviation (Population) | 3.9% | 5.9% |
Similar Demographics by Poverty
Demographics Similar to Immigrants from Latvia by Poverty
In terms of poverty, the demographic groups most similar to Immigrants from Latvia are Immigrants from Egypt (11.5%, a difference of 0.030%), Immigrants from South Africa (11.5%, a difference of 0.070%), Immigrants from Indonesia (11.5%, a difference of 0.14%), Paraguayan (11.4%, a difference of 0.19%), and Australian (11.4%, a difference of 0.19%).
| Demographics | Rating | Rank | Poverty |
| Finns | 95.2 /100 | #91 | Exceptional 11.4% |
| British | 95.0 /100 | #92 | Exceptional 11.4% |
| Romanians | 94.9 /100 | #93 | Exceptional 11.4% |
| Paraguayans | 94.9 /100 | #94 | Exceptional 11.4% |
| Australians | 94.9 /100 | #95 | Exceptional 11.4% |
| Immigrants | South Africa | 94.7 /100 | #96 | Exceptional 11.5% |
| Immigrants | Egypt | 94.6 /100 | #97 | Exceptional 11.5% |
| Immigrants | Latvia | 94.5 /100 | #98 | Exceptional 11.5% |
| Immigrants | Indonesia | 94.2 /100 | #99 | Exceptional 11.5% |
| Scottish | 94.0 /100 | #100 | Exceptional 11.5% |
| Slavs | 93.3 /100 | #101 | Exceptional 11.5% |
| Laotians | 92.4 /100 | #102 | Exceptional 11.6% |
| Okinawans | 92.4 /100 | #103 | Exceptional 11.6% |
| Native Hawaiians | 92.1 /100 | #104 | Exceptional 11.6% |
| Portuguese | 92.1 /100 | #105 | Exceptional 11.6% |
Demographics Similar to Immigrants from Haiti by Poverty
In terms of poverty, the demographic groups most similar to Immigrants from Haiti are West Indian (15.0%, a difference of 0.10%), Comanche (15.0%, a difference of 0.12%), Vietnamese (15.0%, a difference of 0.16%), Immigrants from Latin America (15.0%, a difference of 0.42%), and Immigrants from Barbados (14.9%, a difference of 0.45%).
| Demographics | Rating | Rank | Poverty |
| Immigrants | Bahamas | 0.0 /100 | #276 | Tragic 14.8% |
| Bangladeshis | 0.0 /100 | #277 | Tragic 14.8% |
| Belizeans | 0.0 /100 | #278 | Tragic 14.8% |
| Immigrants | St. Vincent and the Grenadines | 0.0 /100 | #279 | Tragic 14.9% |
| Haitians | 0.0 /100 | #280 | Tragic 14.9% |
| Immigrants | Barbados | 0.0 /100 | #281 | Tragic 14.9% |
| Comanche | 0.0 /100 | #282 | Tragic 15.0% |
| Immigrants | Haiti | 0.0 /100 | #283 | Tragic 15.0% |
| West Indians | 0.0 /100 | #284 | Tragic 15.0% |
| Vietnamese | 0.0 /100 | #285 | Tragic 15.0% |
| Immigrants | Latin America | 0.0 /100 | #286 | Tragic 15.0% |
| Inupiat | 0.0 /100 | #287 | Tragic 15.1% |
| Yaqui | 0.0 /100 | #288 | Tragic 15.1% |
| Immigrants | Belize | 0.0 /100 | #289 | Tragic 15.1% |
| Mexicans | 0.0 /100 | #290 | Tragic 15.1% |