German vs Comanche Poverty
COMPARE
German
Comanche
Poverty
Poverty Comparison
Germans
Comanche
11.1%
POVERTY
98.1/ 100
METRIC RATING
58th/ 347
METRIC RANK
15.0%
POVERTY
0.0/ 100
METRIC RATING
282nd/ 347
METRIC RANK
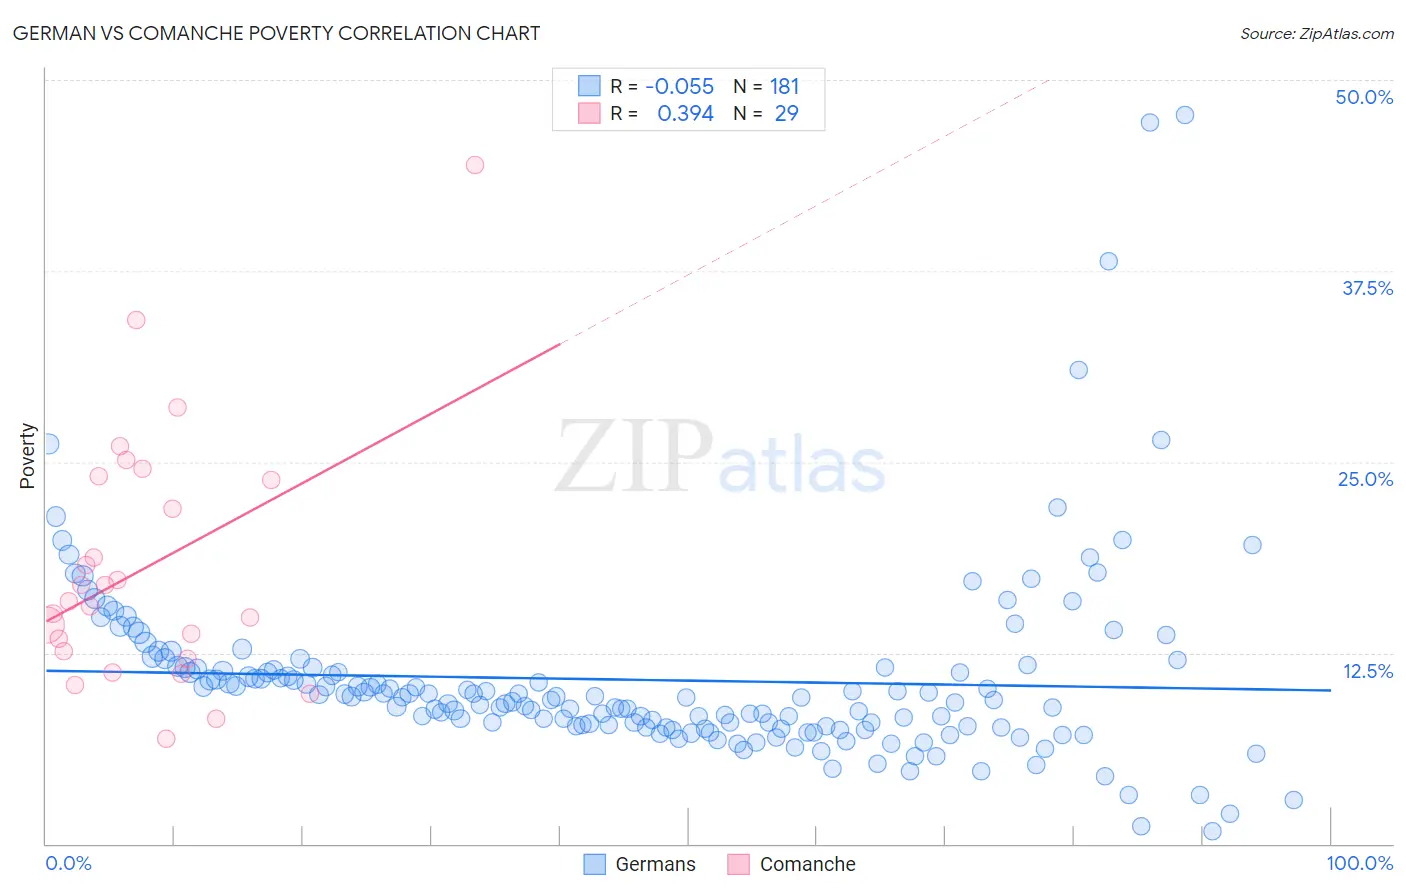
German vs Comanche Poverty Correlation Chart
The statistical analysis conducted on geographies consisting of 580,012,247 people shows a slight negative correlation between the proportion of Germans and poverty level in the United States with a correlation coefficient (R) of -0.055 and weighted average of 11.1%. Similarly, the statistical analysis conducted on geographies consisting of 109,758,867 people shows a mild positive correlation between the proportion of Comanche and poverty level in the United States with a correlation coefficient (R) of 0.394 and weighted average of 15.0%, a difference of 34.3%.
Poverty Correlation Summary
| Measurement | German | Comanche |
| Minimum | 0.84% | 6.8% |
| Maximum | 47.7% | 44.4% |
| Range | 46.9% | 37.6% |
| Mean | 10.7% | 18.1% |
| Median | 9.6% | 15.9% |
| Interquartile 25% (IQ1) | 7.7% | 12.4% |
| Interquartile 75% (IQ3) | 11.5% | 24.0% |
| Interquartile Range (IQR) | 3.8% | 11.6% |
| Standard Deviation (Sample) | 6.2% | 8.3% |
| Standard Deviation (Population) | 6.2% | 8.1% |
Similar Demographics by Poverty
Demographics Similar to Germans by Poverty
In terms of poverty, the demographic groups most similar to Germans are Scandinavian (11.1%, a difference of 0.060%), Estonian (11.1%, a difference of 0.10%), Immigrants from Europe (11.2%, a difference of 0.15%), Immigrants from Sri Lanka (11.2%, a difference of 0.31%), and Immigrants from Italy (11.2%, a difference of 0.37%).
| Demographics | Rating | Rank | Poverty |
| Immigrants | Croatia | 98.7 /100 | #51 | Exceptional 11.0% |
| Immigrants | Philippines | 98.7 /100 | #52 | Exceptional 11.0% |
| Immigrants | Austria | 98.6 /100 | #53 | Exceptional 11.1% |
| Immigrants | Bulgaria | 98.5 /100 | #54 | Exceptional 11.1% |
| Immigrants | Serbia | 98.5 /100 | #55 | Exceptional 11.1% |
| Estonians | 98.2 /100 | #56 | Exceptional 11.1% |
| Scandinavians | 98.2 /100 | #57 | Exceptional 11.1% |
| Germans | 98.1 /100 | #58 | Exceptional 11.1% |
| Immigrants | Europe | 98.0 /100 | #59 | Exceptional 11.2% |
| Immigrants | Sri Lanka | 97.9 /100 | #60 | Exceptional 11.2% |
| Immigrants | Italy | 97.9 /100 | #61 | Exceptional 11.2% |
| Austrians | 97.8 /100 | #62 | Exceptional 11.2% |
| Ukrainians | 97.8 /100 | #63 | Exceptional 11.2% |
| Swiss | 97.7 /100 | #64 | Exceptional 11.2% |
| Immigrants | Asia | 97.5 /100 | #65 | Exceptional 11.2% |
Demographics Similar to Comanche by Poverty
In terms of poverty, the demographic groups most similar to Comanche are Immigrants from Haiti (15.0%, a difference of 0.12%), West Indian (15.0%, a difference of 0.23%), Vietnamese (15.0%, a difference of 0.28%), Immigrants from Barbados (14.9%, a difference of 0.33%), and Haitian (14.9%, a difference of 0.40%).
| Demographics | Rating | Rank | Poverty |
| Immigrants | West Indies | 0.0 /100 | #275 | Tragic 14.8% |
| Immigrants | Bahamas | 0.0 /100 | #276 | Tragic 14.8% |
| Bangladeshis | 0.0 /100 | #277 | Tragic 14.8% |
| Belizeans | 0.0 /100 | #278 | Tragic 14.8% |
| Immigrants | St. Vincent and the Grenadines | 0.0 /100 | #279 | Tragic 14.9% |
| Haitians | 0.0 /100 | #280 | Tragic 14.9% |
| Immigrants | Barbados | 0.0 /100 | #281 | Tragic 14.9% |
| Comanche | 0.0 /100 | #282 | Tragic 15.0% |
| Immigrants | Haiti | 0.0 /100 | #283 | Tragic 15.0% |
| West Indians | 0.0 /100 | #284 | Tragic 15.0% |
| Vietnamese | 0.0 /100 | #285 | Tragic 15.0% |
| Immigrants | Latin America | 0.0 /100 | #286 | Tragic 15.0% |
| Inupiat | 0.0 /100 | #287 | Tragic 15.1% |
| Yaqui | 0.0 /100 | #288 | Tragic 15.1% |
| Immigrants | Belize | 0.0 /100 | #289 | Tragic 15.1% |