Apache vs Comanche Poverty
COMPARE
Apache
Comanche
Poverty
Poverty Comparison
Apache
Comanche
18.4%
POVERTY
0.0/ 100
METRIC RATING
334th/ 347
METRIC RANK
15.0%
POVERTY
0.0/ 100
METRIC RATING
282nd/ 347
METRIC RANK
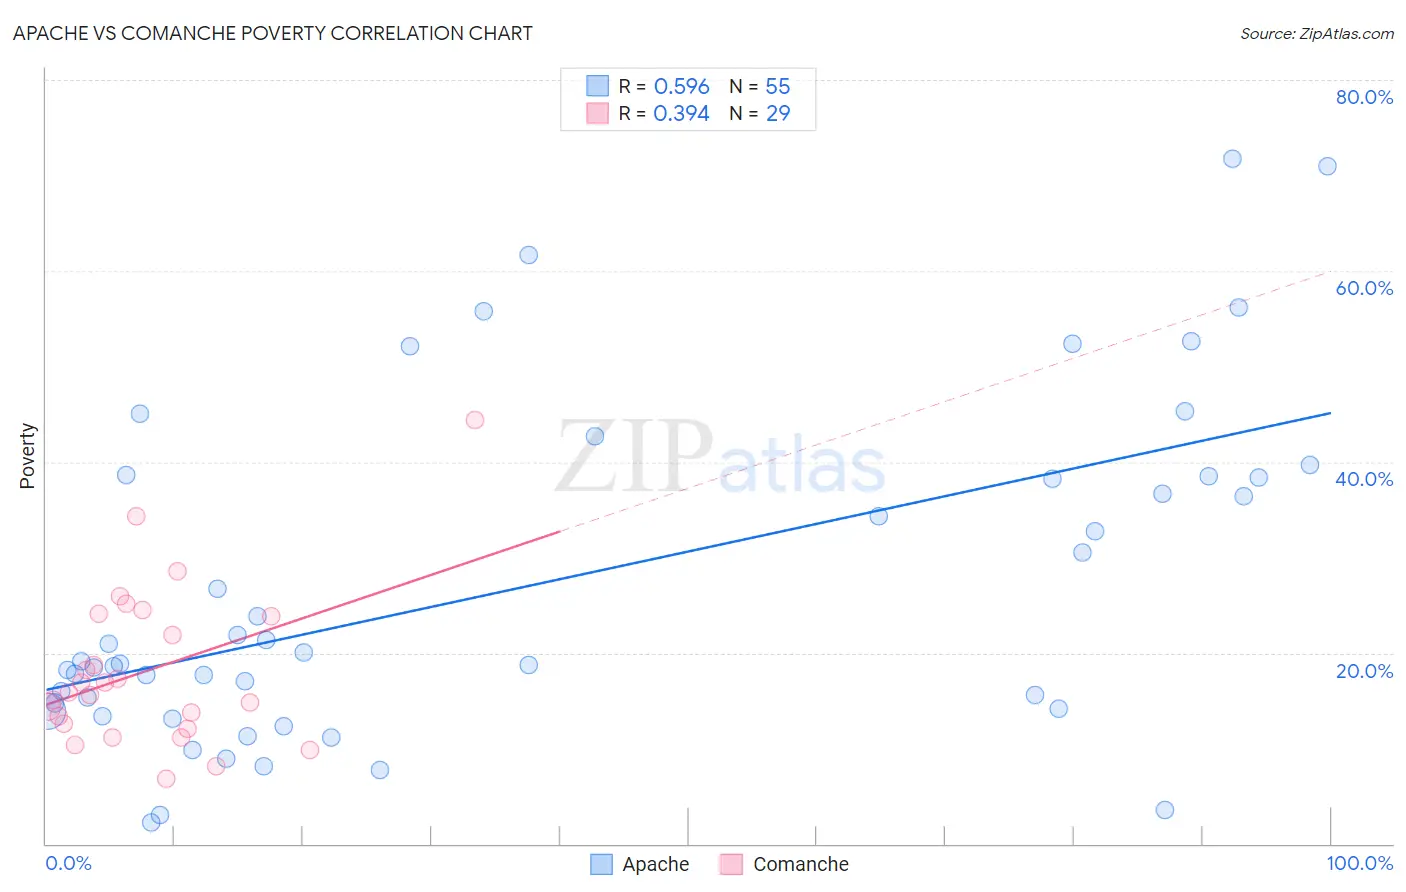
Apache vs Comanche Poverty Correlation Chart
The statistical analysis conducted on geographies consisting of 231,028,854 people shows a substantial positive correlation between the proportion of Apache and poverty level in the United States with a correlation coefficient (R) of 0.596 and weighted average of 18.4%. Similarly, the statistical analysis conducted on geographies consisting of 109,758,867 people shows a mild positive correlation between the proportion of Comanche and poverty level in the United States with a correlation coefficient (R) of 0.394 and weighted average of 15.0%, a difference of 23.2%.
Poverty Correlation Summary
| Measurement | Apache | Comanche |
| Minimum | 2.2% | 6.8% |
| Maximum | 71.7% | 44.4% |
| Range | 69.5% | 37.6% |
| Mean | 26.9% | 18.1% |
| Median | 19.1% | 15.9% |
| Interquartile 25% (IQ1) | 14.2% | 12.4% |
| Interquartile 75% (IQ3) | 38.5% | 24.0% |
| Interquartile Range (IQR) | 24.4% | 11.6% |
| Standard Deviation (Sample) | 17.5% | 8.3% |
| Standard Deviation (Population) | 17.4% | 8.1% |
Similar Demographics by Poverty
Demographics Similar to Apache by Poverty
In terms of poverty, the demographic groups most similar to Apache are Houma (18.4%, a difference of 0.0%), Native/Alaskan (18.1%, a difference of 2.0%), Cheyenne (18.9%, a difference of 2.8%), Immigrants from Dominican Republic (17.8%, a difference of 3.5%), and Dominican (17.6%, a difference of 4.4%).
| Demographics | Rating | Rank | Poverty |
| Kiowa | 0.0 /100 | #327 | Tragic 16.8% |
| Ute | 0.0 /100 | #328 | Tragic 16.9% |
| Blacks/African Americans | 0.0 /100 | #329 | Tragic 17.3% |
| Dominicans | 0.0 /100 | #330 | Tragic 17.6% |
| Immigrants | Dominican Republic | 0.0 /100 | #331 | Tragic 17.8% |
| Natives/Alaskans | 0.0 /100 | #332 | Tragic 18.1% |
| Houma | 0.0 /100 | #333 | Tragic 18.4% |
| Apache | 0.0 /100 | #334 | Tragic 18.4% |
| Cheyenne | 0.0 /100 | #335 | Tragic 18.9% |
| Pueblo | 0.0 /100 | #336 | Tragic 19.4% |
| Sioux | 0.0 /100 | #337 | Tragic 19.8% |
| Yuman | 0.0 /100 | #338 | Tragic 20.2% |
| Crow | 0.0 /100 | #339 | Tragic 20.7% |
| Yup'ik | 0.0 /100 | #340 | Tragic 20.8% |
| Hopi | 0.0 /100 | #341 | Tragic 20.8% |
Demographics Similar to Comanche by Poverty
In terms of poverty, the demographic groups most similar to Comanche are Immigrants from Haiti (15.0%, a difference of 0.12%), West Indian (15.0%, a difference of 0.23%), Vietnamese (15.0%, a difference of 0.28%), Immigrants from Barbados (14.9%, a difference of 0.33%), and Haitian (14.9%, a difference of 0.40%).
| Demographics | Rating | Rank | Poverty |
| Immigrants | West Indies | 0.0 /100 | #275 | Tragic 14.8% |
| Immigrants | Bahamas | 0.0 /100 | #276 | Tragic 14.8% |
| Bangladeshis | 0.0 /100 | #277 | Tragic 14.8% |
| Belizeans | 0.0 /100 | #278 | Tragic 14.8% |
| Immigrants | St. Vincent and the Grenadines | 0.0 /100 | #279 | Tragic 14.9% |
| Haitians | 0.0 /100 | #280 | Tragic 14.9% |
| Immigrants | Barbados | 0.0 /100 | #281 | Tragic 14.9% |
| Comanche | 0.0 /100 | #282 | Tragic 15.0% |
| Immigrants | Haiti | 0.0 /100 | #283 | Tragic 15.0% |
| West Indians | 0.0 /100 | #284 | Tragic 15.0% |
| Vietnamese | 0.0 /100 | #285 | Tragic 15.0% |
| Immigrants | Latin America | 0.0 /100 | #286 | Tragic 15.0% |
| Inupiat | 0.0 /100 | #287 | Tragic 15.1% |
| Yaqui | 0.0 /100 | #288 | Tragic 15.1% |
| Immigrants | Belize | 0.0 /100 | #289 | Tragic 15.1% |