Dutch West Indian vs Comanche Poverty
COMPARE
Dutch West Indian
Comanche
Poverty
Poverty Comparison
Dutch West Indians
Comanche
15.6%
POVERTY
0.0/ 100
METRIC RATING
310th/ 347
METRIC RANK
15.0%
POVERTY
0.0/ 100
METRIC RATING
282nd/ 347
METRIC RANK
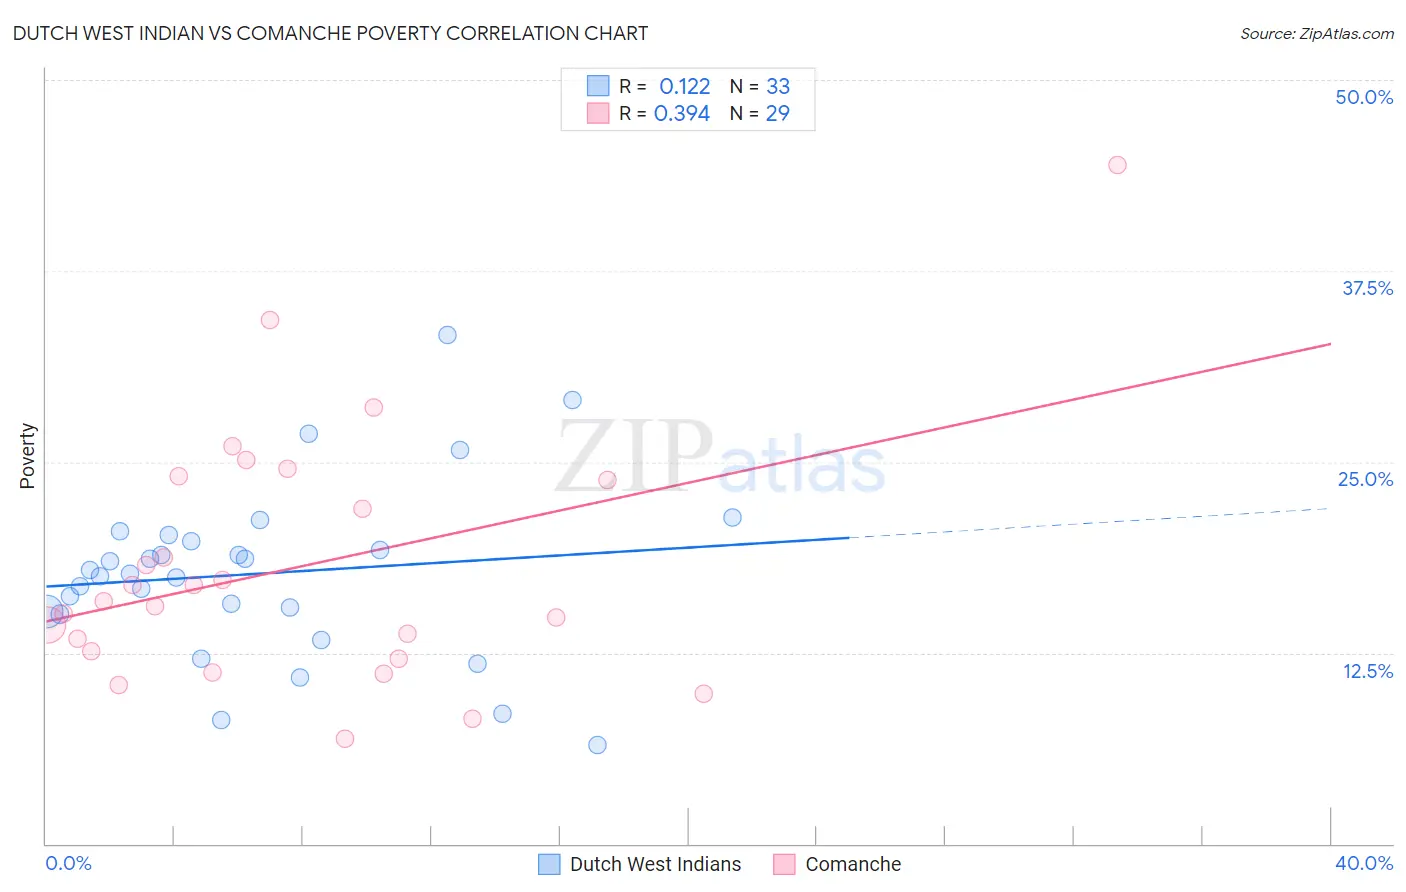
Dutch West Indian vs Comanche Poverty Correlation Chart
The statistical analysis conducted on geographies consisting of 85,763,353 people shows a poor positive correlation between the proportion of Dutch West Indians and poverty level in the United States with a correlation coefficient (R) of 0.122 and weighted average of 15.6%. Similarly, the statistical analysis conducted on geographies consisting of 109,758,867 people shows a mild positive correlation between the proportion of Comanche and poverty level in the United States with a correlation coefficient (R) of 0.394 and weighted average of 15.0%, a difference of 4.5%.
Poverty Correlation Summary
| Measurement | Dutch West Indian | Comanche |
| Minimum | 6.5% | 6.8% |
| Maximum | 33.3% | 44.4% |
| Range | 26.8% | 37.6% |
| Mean | 17.7% | 18.1% |
| Median | 17.7% | 15.9% |
| Interquartile 25% (IQ1) | 15.1% | 12.4% |
| Interquartile 75% (IQ3) | 20.0% | 24.0% |
| Interquartile Range (IQR) | 4.9% | 11.6% |
| Standard Deviation (Sample) | 5.7% | 8.3% |
| Standard Deviation (Population) | 5.6% | 8.1% |
Similar Demographics by Poverty
Demographics Similar to Dutch West Indians by Poverty
In terms of poverty, the demographic groups most similar to Dutch West Indians are Seminole (15.6%, a difference of 0.090%), Choctaw (15.6%, a difference of 0.13%), African (15.6%, a difference of 0.24%), Creek (15.6%, a difference of 0.32%), and Chippewa (15.7%, a difference of 0.39%).
| Demographics | Rating | Rank | Poverty |
| Immigrants | Caribbean | 0.0 /100 | #303 | Tragic 15.5% |
| Immigrants | Mexico | 0.0 /100 | #304 | Tragic 15.5% |
| Immigrants | Guatemala | 0.0 /100 | #305 | Tragic 15.5% |
| Creek | 0.0 /100 | #306 | Tragic 15.6% |
| Africans | 0.0 /100 | #307 | Tragic 15.6% |
| Choctaw | 0.0 /100 | #308 | Tragic 15.6% |
| Seminole | 0.0 /100 | #309 | Tragic 15.6% |
| Dutch West Indians | 0.0 /100 | #310 | Tragic 15.6% |
| Chippewa | 0.0 /100 | #311 | Tragic 15.7% |
| Cajuns | 0.0 /100 | #312 | Tragic 15.7% |
| Immigrants | Grenada | 0.0 /100 | #313 | Tragic 15.8% |
| Immigrants | Somalia | 0.0 /100 | #314 | Tragic 15.8% |
| British West Indians | 0.0 /100 | #315 | Tragic 15.9% |
| Hondurans | 0.0 /100 | #316 | Tragic 15.9% |
| U.S. Virgin Islanders | 0.0 /100 | #317 | Tragic 16.1% |
Demographics Similar to Comanche by Poverty
In terms of poverty, the demographic groups most similar to Comanche are Immigrants from Haiti (15.0%, a difference of 0.12%), West Indian (15.0%, a difference of 0.23%), Vietnamese (15.0%, a difference of 0.28%), Immigrants from Barbados (14.9%, a difference of 0.33%), and Haitian (14.9%, a difference of 0.40%).
| Demographics | Rating | Rank | Poverty |
| Immigrants | West Indies | 0.0 /100 | #275 | Tragic 14.8% |
| Immigrants | Bahamas | 0.0 /100 | #276 | Tragic 14.8% |
| Bangladeshis | 0.0 /100 | #277 | Tragic 14.8% |
| Belizeans | 0.0 /100 | #278 | Tragic 14.8% |
| Immigrants | St. Vincent and the Grenadines | 0.0 /100 | #279 | Tragic 14.9% |
| Haitians | 0.0 /100 | #280 | Tragic 14.9% |
| Immigrants | Barbados | 0.0 /100 | #281 | Tragic 14.9% |
| Comanche | 0.0 /100 | #282 | Tragic 15.0% |
| Immigrants | Haiti | 0.0 /100 | #283 | Tragic 15.0% |
| West Indians | 0.0 /100 | #284 | Tragic 15.0% |
| Vietnamese | 0.0 /100 | #285 | Tragic 15.0% |
| Immigrants | Latin America | 0.0 /100 | #286 | Tragic 15.0% |
| Inupiat | 0.0 /100 | #287 | Tragic 15.1% |
| Yaqui | 0.0 /100 | #288 | Tragic 15.1% |
| Immigrants | Belize | 0.0 /100 | #289 | Tragic 15.1% |