Immigrants from Burma/Myanmar vs Austrian Single Female Poverty

COMPARE

Immigrants from Burma/Myanmar
Race
Ancestry
AfghanAfricanAlaska NativeAlaskan AthabascanAlbanianAleutAlsatianAmericanApacheArabArapahoArgentineanArmenianAssyrian/Chaldean/SyriacAustralianBahamianBangladeshiBarbadianBasqueBelgianBelizeanBermudanBhutaneseBlackfeetBolivianBrazilianBritishBritish West IndianBulgarianBurmeseCajunCambodianCanadianCape VerdeanCarpatho RusynCelticCentral AmericanCentral American IndianCherokeeCheyenneChickasawChileanChineseChippewaChoctawColombianColvilleComancheCosta RicanCreeCreekCroatianCrowCubanCypriotCzechCzechoslovakianDanishDelawareDominicanDutchDutch West IndianEastern EuropeanEcuadorianEgyptianEnglishEstonianEthiopianEuropeanFijianFilipinoFinnishFrenchFrench American IndianFrench CanadianGermanGerman RussianGhanaianGreekGuamanian/ChamorroGuatemalanGuyaneseHaitianHmongHonduranHopiHoumaHungarianIcelanderIndian (Asian)IndonesianInupiatIranianIraqiIrishIroquoisIsraeliItalianJamaicanJapaneseJordanianKenyanKiowaKoreanLaotianLatvianLebaneseLiberianLithuanianLumbeeLuxembourgerMacedonianMalaysianMalteseMarshalleseMenomineeMexicanMexican American IndianMongolianMoroccanNative HawaiianNavajoNepaleseNew ZealanderNicaraguanNigerianNorthern EuropeanNorwegianOkinawanOsageOttawaPaiutePakistaniPalestinianPanamanianParaguayanPennsylvania GermanPeruvianPimaPolishPortuguesePotawatomiPuebloPuerto RicanPuget Sound SalishRomanianRussianSalvadoranSamoanScandinavianScotch-IrishScottishSeminoleSenegaleseSerbianShoshoneSierra LeoneanSiouxSlavicSlovakSloveneSomaliSouth AfricanSouth AmericanSouth American IndianSoviet UnionSpaniardSpanishSpanish AmericanSpanish American IndianSri LankanSubsaharan AfricanSudaneseSwedishSwissSyrianTaiwaneseThaiTlingit-HaidaTohono O'OdhamTonganTrinidadian and TobagonianTsimshianTurkishU.S. Virgin IslanderUgandanUkrainianUruguayanUteVenezuelanVietnameseWelshWest IndianYakamaYaquiYugoslavianYumanYup'ikZimbabwean
Immigration
NonimmigrantsImmigrantsAfghanistanAfricaAlbaniaArgentinaArmeniaAsiaAustraliaAustriaBahamasBangladeshBarbadosBelarusBelgiumBelizeBoliviaBosnia and HerzegovinaBrazilBulgariaBurma/MyanmarCabo VerdeCambodiaCameroonCanadaCaribbeanCentral AmericaChileChinaColombiaCongoCosta RicaCroatiaCubaCzechoslovakiaDenmarkDominicaDominican RepublicEastern AfricaEastern AsiaEastern EuropeEcuadorEgyptEl SalvadorEnglandEritreaEthiopiaEuropeFijiFranceGermanyGhanaGreeceGrenadaGuatemalaGuyanaHaitiHondurasHong KongHungaryIndiaIndonesiaIranIraqIrelandIsraelItalyJamaicaJapanJordanKazakhstanKenyaKoreaKuwaitLaosLatin AmericaLatviaLebanonLiberiaLithuaniaMalaysiaMexicoMicronesiaMiddle AfricaMoldovaMoroccoNepalNetherlandsNicaraguaNigeriaNorth AmericaNorth MacedoniaNorthern AfricaNorthern EuropeNorwayOceaniaPakistanPanamaPeruPhilippinesPolandPortugalRomaniaRussiaSaudi ArabiaScotlandSenegalSerbiaSierra LeoneSingaporeSomaliaSouth AfricaSouth AmericaSouth Central AsiaSouth Eastern AsiaSouthern EuropeSpainSri LankaSt. Vincent and the GrenadinesSudanSwedenSwitzerlandSyriaTaiwanThailandTrinidad and TobagoTurkeyUgandaUkraineUruguayUzbekistanVenezuelaVietnamWest IndiesWestern AfricaWestern AsiaWestern EuropeYemenZaireZimbabweAzores
Austrian
Race
Ancestry
AfghanAfricanAlaska NativeAlaskan AthabascanAlbanianAleutAlsatianAmericanApacheArabArapahoArgentineanArmenianAssyrian/Chaldean/SyriacAustralianAustrianBahamianBangladeshiBarbadianBasqueBelgianBelizeanBermudanBhutaneseBlackfeetBolivianBrazilianBritishBritish West IndianBulgarianBurmeseCajunCambodianCanadianCape VerdeanCarpatho RusynCelticCentral AmericanCentral American IndianCherokeeCheyenneChickasawChileanChineseChippewaChoctawColombianColvilleComancheCosta RicanCreeCreekCroatianCrowCubanCypriotCzechCzechoslovakianDanishDelawareDominicanDutchDutch West IndianEastern EuropeanEcuadorianEgyptianEnglishEstonianEthiopianEuropeanFijianFilipinoFinnishFrenchFrench American IndianFrench CanadianGermanGerman RussianGhanaianGreekGuamanian/ChamorroGuatemalanGuyaneseHaitianHmongHonduranHopiHoumaHungarianIcelanderIndian (Asian)IndonesianInupiatIranianIraqiIrishIroquoisIsraeliItalianJamaicanJapaneseJordanianKenyanKiowaKoreanLaotianLatvianLebaneseLiberianLithuanianLumbeeLuxembourgerMacedonianMalaysianMalteseMarshalleseMenomineeMexicanMexican American IndianMongolianMoroccanNative HawaiianNavajoNepaleseNew ZealanderNicaraguanNigerianNorthern EuropeanNorwegianOkinawanOsageOttawaPaiutePakistaniPalestinianPanamanianParaguayanPennsylvania GermanPeruvianPimaPolishPortuguesePotawatomiPuebloPuerto RicanPuget Sound SalishRomanianRussianSalvadoranSamoanScandinavianScotch-IrishScottishSeminoleSenegaleseSerbianShoshoneSierra LeoneanSiouxSlavicSlovakSloveneSomaliSouth AfricanSouth AmericanSouth American IndianSoviet UnionSpaniardSpanishSpanish AmericanSpanish American IndianSri LankanSubsaharan AfricanSudaneseSwedishSwissSyrianTaiwaneseThaiTlingit-HaidaTohono O'OdhamTonganTrinidadian and TobagonianTsimshianTurkishU.S. Virgin IslanderUgandanUkrainianUruguayanUteVenezuelanVietnameseWelshWest IndianYakamaYaquiYugoslavianYumanYup'ikZimbabwean
Immigration
NonimmigrantsImmigrantsAfghanistanAfricaAlbaniaArgentinaArmeniaAsiaAustraliaAustriaBahamasBangladeshBarbadosBelarusBelgiumBelizeBoliviaBosnia and HerzegovinaBrazilBulgariaCabo VerdeCambodiaCameroonCanadaCaribbeanCentral AmericaChileChinaColombiaCongoCosta RicaCroatiaCubaCzechoslovakiaDenmarkDominicaDominican RepublicEastern AfricaEastern AsiaEastern EuropeEcuadorEgyptEl SalvadorEnglandEritreaEthiopiaEuropeFijiFranceGermanyGhanaGreeceGrenadaGuatemalaGuyanaHaitiHondurasHong KongHungaryIndiaIndonesiaIranIraqIrelandIsraelItalyJamaicaJapanJordanKazakhstanKenyaKoreaKuwaitLaosLatin AmericaLatviaLebanonLiberiaLithuaniaMalaysiaMexicoMicronesiaMiddle AfricaMoldovaMoroccoNepalNetherlandsNicaraguaNigeriaNorth AmericaNorth MacedoniaNorthern AfricaNorthern EuropeNorwayOceaniaPakistanPanamaPeruPhilippinesPolandPortugalRomaniaRussiaSaudi ArabiaScotlandSenegalSerbiaSierra LeoneSingaporeSomaliaSouth AfricaSouth AmericaSouth Central AsiaSouth Eastern AsiaSouthern EuropeSpainSri LankaSt. Vincent and the GrenadinesSudanSwedenSwitzerlandSyriaTaiwanThailandTrinidad and TobagoTurkeyUgandaUkraineUruguayUzbekistanVenezuelaVietnamWest IndiesWestern AfricaWestern AsiaWestern EuropeYemenZaireZimbabweAzores
Single Female Poverty
Income
Poverty
Unemployment
Labor Participation
Family Structure
Vehicle Availability
Education Level
Disability

Single Female Poverty Comparison

Immigrants from Burma/Myanmar

Austrians

Tragic
Excellent
22.6%
SINGLE FEMALE POVERTY
0.8/ 100
METRIC RATING
254th/ 347
METRIC RANK
20.4%
SINGLE FEMALE POVERTY
85.8/ 100
METRIC RATING
145th/ 347
METRIC RANK

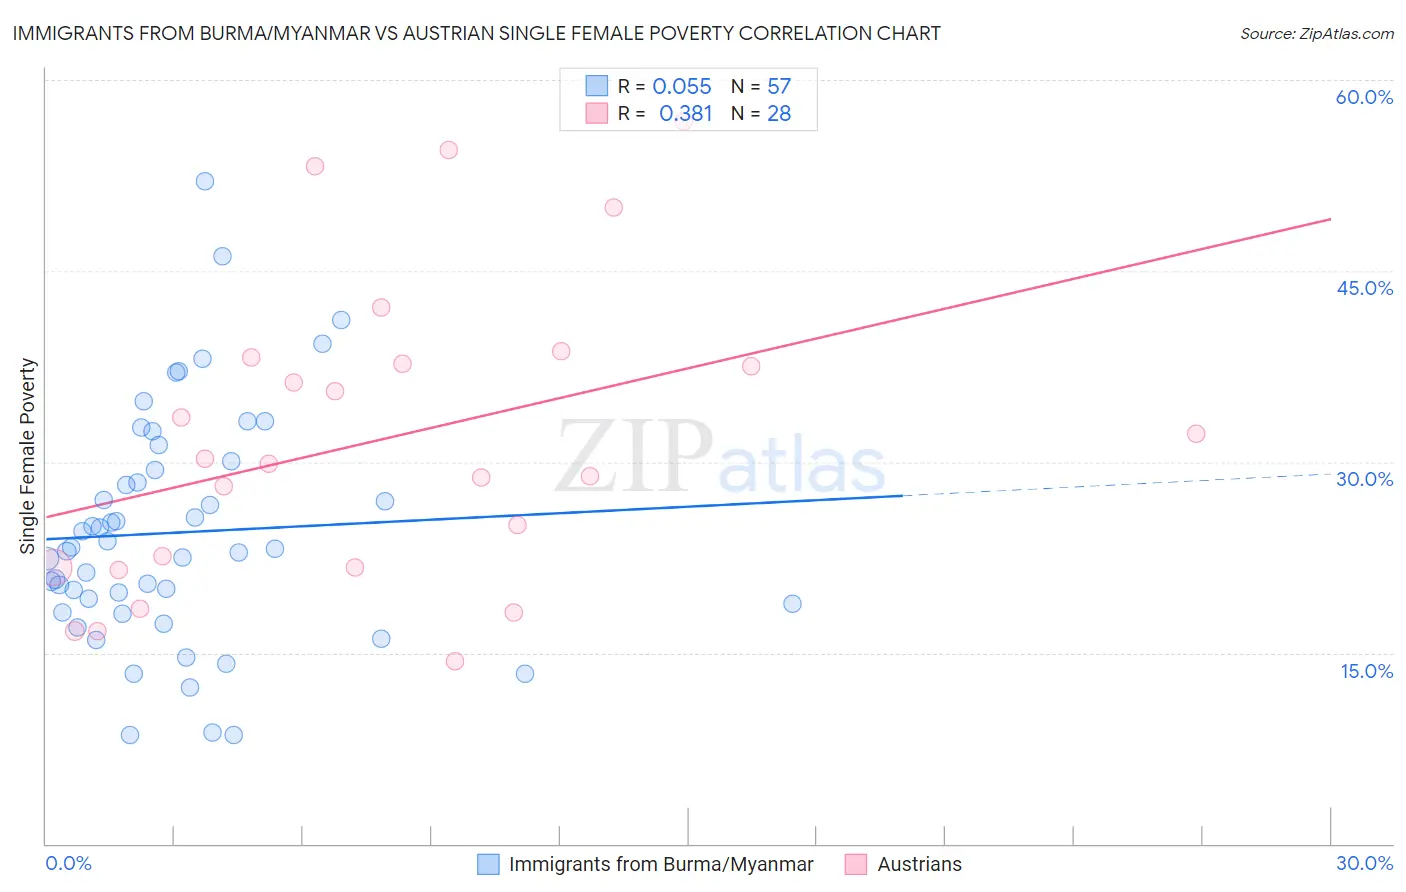
Immigrants from Burma/Myanmar vs Austrian Single Female Poverty Correlation Chart

The statistical analysis conducted on geographies consisting of 171,274,747 people shows a slight positive correlation between the proportion of Immigrants from Burma/Myanmar and poverty level among single females in the United States with a correlation coefficient (R) of 0.055 and weighted average of 22.6%. Similarly, the statistical analysis conducted on geographies consisting of 441,015,533 people shows a mild positive correlation between the proportion of Austrians and poverty level among single females in the United States with a correlation coefficient (R) of 0.381 and weighted average of 20.4%, a difference of 10.5%.
Immigrants from Burma/Myanmar vs Austrian Single Female Poverty

Single Female Poverty Correlation Summary

MeasurementImmigrants from Burma/MyanmarAustrian
Minimum8.5%14.3%
Maximum52.0%56.8%
Range43.5%42.4%
Mean24.5%31.8%
Median23.1%30.1%
Interquartile 25% (IQ1)18.5%21.7%
Interquartile 75% (IQ3)29.7%37.9%
Interquartile Range (IQR)11.2%16.2%
Standard Deviation (Sample)9.1%11.9%
Standard Deviation (Population)9.1%11.7%

Similar Demographics by Single Female Poverty

Demographics Similar to Immigrants from Burma/Myanmar by Single Female Poverty

In terms of single female poverty, the demographic groups most similar to Immigrants from Burma/Myanmar are Immigrants from Sudan (22.6%, a difference of 0.0%), Immigrants from Liberia (22.5%, a difference of 0.10%), Immigrants from Belize (22.6%, a difference of 0.15%), Delaware (22.5%, a difference of 0.19%), and Sudanese (22.6%, a difference of 0.29%).
DemographicsRating | RankSingle Female Poverty
Immigrants | El Salvador
1.4
/100
|
#247
Tragic
22.4%
Belizeans
1.4
/100
|
#248
Tragic
22.4%
Immigrants | Caribbean
1.3
/100
|
#249
Tragic
22.4%
Immigrants | Bahamas
1.2
/100
|
#250
Tragic
22.5%
Immigrants | West Indies
1.0
/100
|
#251
Tragic
22.5%
Delaware
1.0
/100
|
#252
Tragic
22.5%
Immigrants | Liberia
0.9
/100
|
#253
Tragic
22.5%
Immigrants | Burma/Myanmar
0.8
/100
|
#254
Tragic
22.6%
Immigrants | Sudan
0.8
/100
|
#255
Tragic
22.6%
Immigrants | Belize
0.8
/100
|
#256
Tragic
22.6%
Sudanese
0.7
/100
|
#257
Tragic
22.6%
Bahamians
0.6
/100
|
#258
Tragic
22.7%
Whites/Caucasians
0.6
/100
|
#259
Tragic
22.7%
Celtics
0.5
/100
|
#260
Tragic
22.7%
Immigrants | Cabo Verde
0.4
/100
|
#261
Tragic
22.8%

Demographics Similar to Austrians by Single Female Poverty

In terms of single female poverty, the demographic groups most similar to Austrians are Venezuelan (20.4%, a difference of 0.030%), South African (20.4%, a difference of 0.060%), Luxembourger (20.4%, a difference of 0.11%), Immigrants from Uzbekistan (20.3%, a difference of 0.36%), and Australian (20.3%, a difference of 0.37%).
DemographicsRating | RankSingle Female Poverty
Slovenes
90.5
/100
|
#138
Exceptional
20.3%
Immigrants | Kuwait
90.4
/100
|
#139
Exceptional
20.3%
Syrians
90.4
/100
|
#140
Exceptional
20.3%
Immigrants | North America
89.5
/100
|
#141
Excellent
20.3%
Immigrants | Uganda
89.1
/100
|
#142
Excellent
20.3%
Australians
88.4
/100
|
#143
Excellent
20.3%
Immigrants | Uzbekistan
88.3
/100
|
#144
Excellent
20.3%
Austrians
85.8
/100
|
#145
Excellent
20.4%
Venezuelans
85.5
/100
|
#146
Excellent
20.4%
South Africans
85.3
/100
|
#147
Excellent
20.4%
Luxembourgers
84.9
/100
|
#148
Excellent
20.4%
Portuguese
81.5
/100
|
#149
Excellent
20.5%
Immigrants | Denmark
80.5
/100
|
#150
Excellent
20.5%
Puget Sound Salish
79.6
/100
|
#151
Good
20.6%
Immigrants | Uruguay
77.7
/100
|
#152
Good
20.6%