Immigrants from Burma/Myanmar vs Sierra Leonean Single Female Poverty
COMPARE
Immigrants from Burma/Myanmar
Sierra Leonean
Single Female Poverty
Single Female Poverty Comparison
Immigrants from Burma/Myanmar
Sierra Leoneans
22.6%
SINGLE FEMALE POVERTY
0.8/ 100
METRIC RATING
254th/ 347
METRIC RANK
19.7%
SINGLE FEMALE POVERTY
97.9/ 100
METRIC RATING
99th/ 347
METRIC RANK
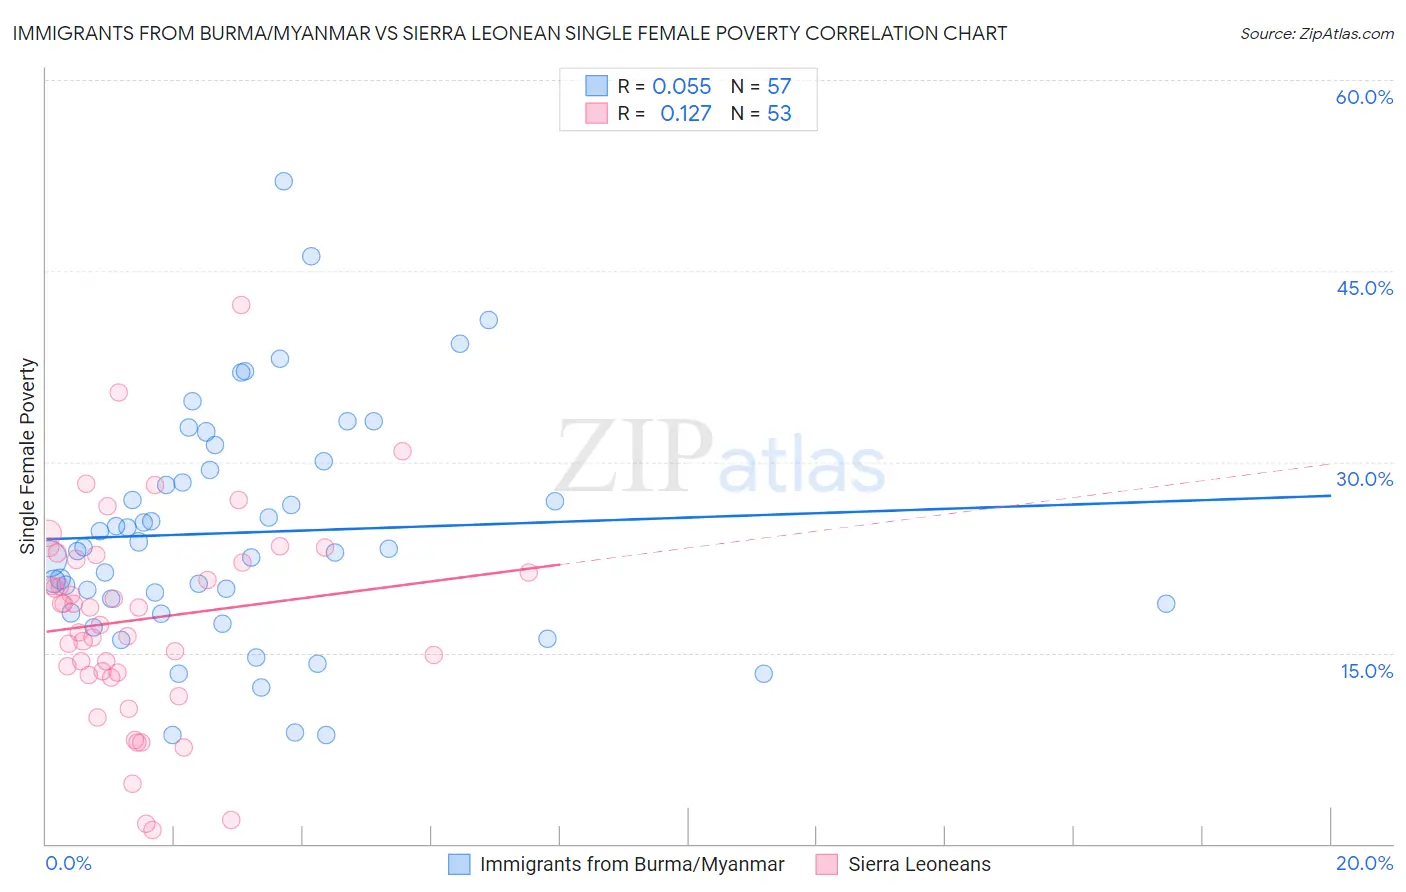
Immigrants from Burma/Myanmar vs Sierra Leonean Single Female Poverty Correlation Chart
The statistical analysis conducted on geographies consisting of 171,274,747 people shows a slight positive correlation between the proportion of Immigrants from Burma/Myanmar and poverty level among single females in the United States with a correlation coefficient (R) of 0.055 and weighted average of 22.6%. Similarly, the statistical analysis conducted on geographies consisting of 83,185,885 people shows a poor positive correlation between the proportion of Sierra Leoneans and poverty level among single females in the United States with a correlation coefficient (R) of 0.127 and weighted average of 19.7%, a difference of 14.2%.
Single Female Poverty Correlation Summary
| Measurement | Immigrants from Burma/Myanmar | Sierra Leonean |
| Minimum | 8.5% | 1.1% |
| Maximum | 52.0% | 42.4% |
| Range | 43.5% | 41.2% |
| Mean | 24.5% | 17.6% |
| Median | 23.1% | 18.6% |
| Interquartile 25% (IQ1) | 18.5% | 13.4% |
| Interquartile 75% (IQ3) | 29.7% | 22.5% |
| Interquartile Range (IQR) | 11.2% | 9.2% |
| Standard Deviation (Sample) | 9.1% | 8.1% |
| Standard Deviation (Population) | 9.1% | 8.0% |
Similar Demographics by Single Female Poverty
Demographics Similar to Immigrants from Burma/Myanmar by Single Female Poverty
In terms of single female poverty, the demographic groups most similar to Immigrants from Burma/Myanmar are Immigrants from Sudan (22.6%, a difference of 0.0%), Immigrants from Liberia (22.5%, a difference of 0.10%), Immigrants from Belize (22.6%, a difference of 0.15%), Delaware (22.5%, a difference of 0.19%), and Sudanese (22.6%, a difference of 0.29%).
| Demographics | Rating | Rank | Single Female Poverty |
| Immigrants | El Salvador | 1.4 /100 | #247 | Tragic 22.4% |
| Belizeans | 1.4 /100 | #248 | Tragic 22.4% |
| Immigrants | Caribbean | 1.3 /100 | #249 | Tragic 22.4% |
| Immigrants | Bahamas | 1.2 /100 | #250 | Tragic 22.5% |
| Immigrants | West Indies | 1.0 /100 | #251 | Tragic 22.5% |
| Delaware | 1.0 /100 | #252 | Tragic 22.5% |
| Immigrants | Liberia | 0.9 /100 | #253 | Tragic 22.5% |
| Immigrants | Burma/Myanmar | 0.8 /100 | #254 | Tragic 22.6% |
| Immigrants | Sudan | 0.8 /100 | #255 | Tragic 22.6% |
| Immigrants | Belize | 0.8 /100 | #256 | Tragic 22.6% |
| Sudanese | 0.7 /100 | #257 | Tragic 22.6% |
| Bahamians | 0.6 /100 | #258 | Tragic 22.7% |
| Whites/Caucasians | 0.6 /100 | #259 | Tragic 22.7% |
| Celtics | 0.5 /100 | #260 | Tragic 22.7% |
| Immigrants | Cabo Verde | 0.4 /100 | #261 | Tragic 22.8% |
Demographics Similar to Sierra Leoneans by Single Female Poverty
In terms of single female poverty, the demographic groups most similar to Sierra Leoneans are Immigrants from France (19.7%, a difference of 0.010%), Croatian (19.7%, a difference of 0.14%), Immigrants from Brazil (19.7%, a difference of 0.23%), Ukrainian (19.8%, a difference of 0.25%), and Estonian (19.7%, a difference of 0.28%).
| Demographics | Rating | Rank | Single Female Poverty |
| Italians | 98.8 /100 | #92 | Exceptional 19.6% |
| Immigrants | Austria | 98.8 /100 | #93 | Exceptional 19.6% |
| Romanians | 98.6 /100 | #94 | Exceptional 19.6% |
| Estonians | 98.2 /100 | #95 | Exceptional 19.7% |
| Immigrants | Brazil | 98.2 /100 | #96 | Exceptional 19.7% |
| Croatians | 98.1 /100 | #97 | Exceptional 19.7% |
| Immigrants | France | 97.9 /100 | #98 | Exceptional 19.7% |
| Sierra Leoneans | 97.9 /100 | #99 | Exceptional 19.7% |
| Ukrainians | 97.6 /100 | #100 | Exceptional 19.8% |
| Immigrants | Belgium | 97.3 /100 | #101 | Exceptional 19.8% |
| Immigrants | Cameroon | 97.3 /100 | #102 | Exceptional 19.8% |
| Immigrants | Southern Europe | 97.1 /100 | #103 | Exceptional 19.9% |
| Chileans | 96.9 /100 | #104 | Exceptional 19.9% |
| Israelis | 96.9 /100 | #105 | Exceptional 19.9% |
| Ethiopians | 96.7 /100 | #106 | Exceptional 19.9% |