U.S. Virgin Islander vs Austrian Single Female Poverty
COMPARE
U.S. Virgin Islander
Austrian
Single Female Poverty
Single Female Poverty Comparison
U.S. Virgin Islanders
Austrians
24.2%
SINGLE FEMALE POVERTY
0.0/ 100
METRIC RATING
289th/ 347
METRIC RANK
20.4%
SINGLE FEMALE POVERTY
85.8/ 100
METRIC RATING
145th/ 347
METRIC RANK
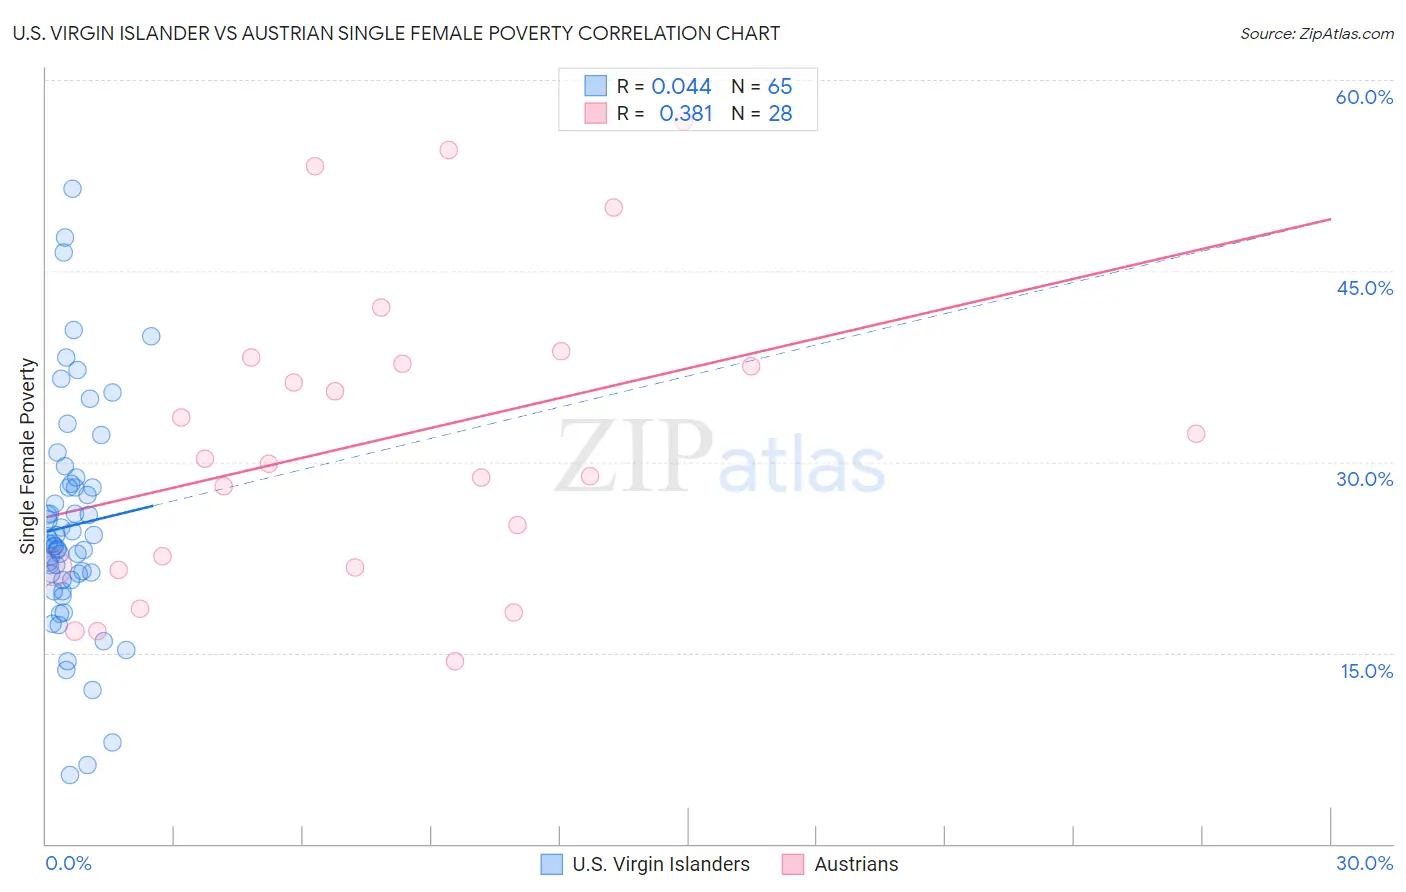
U.S. Virgin Islander vs Austrian Single Female Poverty Correlation Chart
The statistical analysis conducted on geographies consisting of 87,304,073 people shows no correlation between the proportion of U.S. Virgin Islanders and poverty level among single females in the United States with a correlation coefficient (R) of 0.044 and weighted average of 24.2%. Similarly, the statistical analysis conducted on geographies consisting of 441,015,533 people shows a mild positive correlation between the proportion of Austrians and poverty level among single females in the United States with a correlation coefficient (R) of 0.381 and weighted average of 20.4%, a difference of 18.4%.
Single Female Poverty Correlation Summary
| Measurement | U.S. Virgin Islander | Austrian |
| Minimum | 5.4% | 14.3% |
| Maximum | 51.4% | 56.8% |
| Range | 46.0% | 42.4% |
| Mean | 25.0% | 31.8% |
| Median | 23.5% | 30.1% |
| Interquartile 25% (IQ1) | 20.7% | 21.7% |
| Interquartile 75% (IQ3) | 28.2% | 37.9% |
| Interquartile Range (IQR) | 7.5% | 16.2% |
| Standard Deviation (Sample) | 8.9% | 11.9% |
| Standard Deviation (Population) | 8.9% | 11.7% |
Similar Demographics by Single Female Poverty
Demographics Similar to U.S. Virgin Islanders by Single Female Poverty
In terms of single female poverty, the demographic groups most similar to U.S. Virgin Islanders are Spanish American (24.2%, a difference of 0.050%), Bangladeshi (24.2%, a difference of 0.070%), Cree (24.1%, a difference of 0.22%), Immigrants from Guatemala (24.1%, a difference of 0.26%), and Indonesian (24.3%, a difference of 0.34%).
| Demographics | Rating | Rank | Single Female Poverty |
| Guatemalans | 0.0 /100 | #282 | Tragic 23.8% |
| German Russians | 0.0 /100 | #283 | Tragic 23.9% |
| Immigrants | Dominica | 0.0 /100 | #284 | Tragic 23.9% |
| Immigrants | Guatemala | 0.0 /100 | #285 | Tragic 24.1% |
| Cree | 0.0 /100 | #286 | Tragic 24.1% |
| Bangladeshis | 0.0 /100 | #287 | Tragic 24.2% |
| Spanish Americans | 0.0 /100 | #288 | Tragic 24.2% |
| U.S. Virgin Islanders | 0.0 /100 | #289 | Tragic 24.2% |
| Indonesians | 0.0 /100 | #290 | Tragic 24.3% |
| Osage | 0.0 /100 | #291 | Tragic 24.4% |
| Alsatians | 0.0 /100 | #292 | Tragic 24.5% |
| Americans | 0.0 /100 | #293 | Tragic 24.5% |
| French American Indians | 0.0 /100 | #294 | Tragic 24.6% |
| Hispanics or Latinos | 0.0 /100 | #295 | Tragic 24.6% |
| Africans | 0.0 /100 | #296 | Tragic 24.8% |
Demographics Similar to Austrians by Single Female Poverty
In terms of single female poverty, the demographic groups most similar to Austrians are Venezuelan (20.4%, a difference of 0.030%), South African (20.4%, a difference of 0.060%), Luxembourger (20.4%, a difference of 0.11%), Immigrants from Uzbekistan (20.3%, a difference of 0.36%), and Australian (20.3%, a difference of 0.37%).
| Demographics | Rating | Rank | Single Female Poverty |
| Slovenes | 90.5 /100 | #138 | Exceptional 20.3% |
| Immigrants | Kuwait | 90.4 /100 | #139 | Exceptional 20.3% |
| Syrians | 90.4 /100 | #140 | Exceptional 20.3% |
| Immigrants | North America | 89.5 /100 | #141 | Excellent 20.3% |
| Immigrants | Uganda | 89.1 /100 | #142 | Excellent 20.3% |
| Australians | 88.4 /100 | #143 | Excellent 20.3% |
| Immigrants | Uzbekistan | 88.3 /100 | #144 | Excellent 20.3% |
| Austrians | 85.8 /100 | #145 | Excellent 20.4% |
| Venezuelans | 85.5 /100 | #146 | Excellent 20.4% |
| South Africans | 85.3 /100 | #147 | Excellent 20.4% |
| Luxembourgers | 84.9 /100 | #148 | Excellent 20.4% |
| Portuguese | 81.5 /100 | #149 | Excellent 20.5% |
| Immigrants | Denmark | 80.5 /100 | #150 | Excellent 20.5% |
| Puget Sound Salish | 79.6 /100 | #151 | Good 20.6% |
| Immigrants | Uruguay | 77.7 /100 | #152 | Good 20.6% |