Immigrants from Burma/Myanmar vs Immigrants from Indonesia Single Female Poverty
COMPARE
Immigrants from Burma/Myanmar
Immigrants from Indonesia
Single Female Poverty
Single Female Poverty Comparison
Immigrants from Burma/Myanmar
Immigrants from Indonesia
22.6%
SINGLE FEMALE POVERTY
0.8/ 100
METRIC RATING
254th/ 347
METRIC RANK
18.9%
SINGLE FEMALE POVERTY
99.8/ 100
METRIC RATING
45th/ 347
METRIC RANK
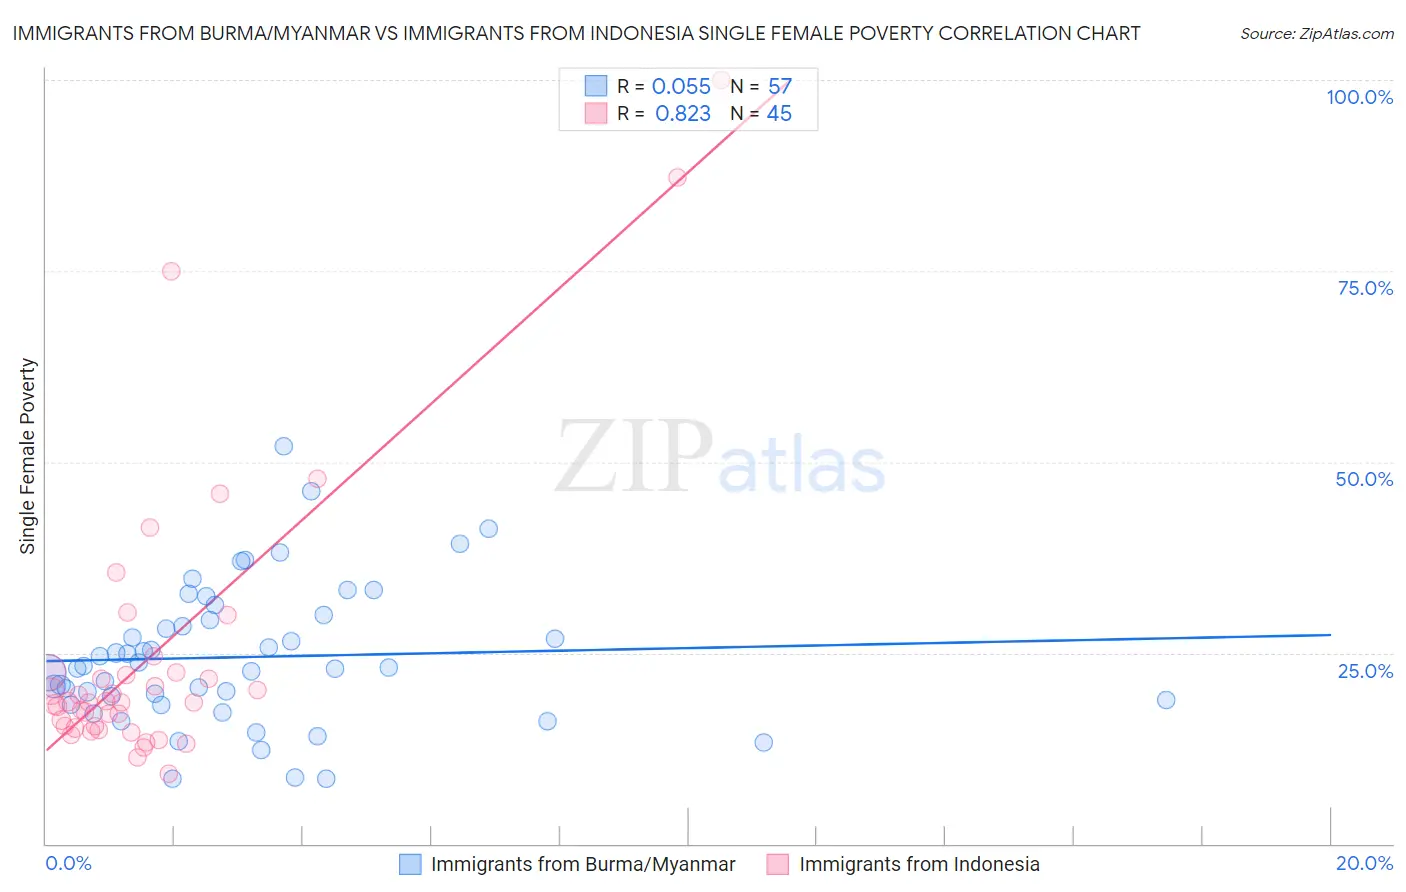
Immigrants from Burma/Myanmar vs Immigrants from Indonesia Single Female Poverty Correlation Chart
The statistical analysis conducted on geographies consisting of 171,274,747 people shows a slight positive correlation between the proportion of Immigrants from Burma/Myanmar and poverty level among single females in the United States with a correlation coefficient (R) of 0.055 and weighted average of 22.6%. Similarly, the statistical analysis conducted on geographies consisting of 213,892,292 people shows a very strong positive correlation between the proportion of Immigrants from Indonesia and poverty level among single females in the United States with a correlation coefficient (R) of 0.823 and weighted average of 18.9%, a difference of 19.3%.
Single Female Poverty Correlation Summary
| Measurement | Immigrants from Burma/Myanmar | Immigrants from Indonesia |
| Minimum | 8.5% | 9.1% |
| Maximum | 52.0% | 100.0% |
| Range | 43.5% | 90.9% |
| Mean | 24.5% | 24.9% |
| Median | 23.1% | 18.5% |
| Interquartile 25% (IQ1) | 18.5% | 15.2% |
| Interquartile 75% (IQ3) | 29.7% | 22.5% |
| Interquartile Range (IQR) | 11.2% | 7.2% |
| Standard Deviation (Sample) | 9.1% | 19.0% |
| Standard Deviation (Population) | 9.1% | 18.8% |
Similar Demographics by Single Female Poverty
Demographics Similar to Immigrants from Burma/Myanmar by Single Female Poverty
In terms of single female poverty, the demographic groups most similar to Immigrants from Burma/Myanmar are Immigrants from Sudan (22.6%, a difference of 0.0%), Immigrants from Liberia (22.5%, a difference of 0.10%), Immigrants from Belize (22.6%, a difference of 0.15%), Delaware (22.5%, a difference of 0.19%), and Sudanese (22.6%, a difference of 0.29%).
| Demographics | Rating | Rank | Single Female Poverty |
| Immigrants | El Salvador | 1.4 /100 | #247 | Tragic 22.4% |
| Belizeans | 1.4 /100 | #248 | Tragic 22.4% |
| Immigrants | Caribbean | 1.3 /100 | #249 | Tragic 22.4% |
| Immigrants | Bahamas | 1.2 /100 | #250 | Tragic 22.5% |
| Immigrants | West Indies | 1.0 /100 | #251 | Tragic 22.5% |
| Delaware | 1.0 /100 | #252 | Tragic 22.5% |
| Immigrants | Liberia | 0.9 /100 | #253 | Tragic 22.5% |
| Immigrants | Burma/Myanmar | 0.8 /100 | #254 | Tragic 22.6% |
| Immigrants | Sudan | 0.8 /100 | #255 | Tragic 22.6% |
| Immigrants | Belize | 0.8 /100 | #256 | Tragic 22.6% |
| Sudanese | 0.7 /100 | #257 | Tragic 22.6% |
| Bahamians | 0.6 /100 | #258 | Tragic 22.7% |
| Whites/Caucasians | 0.6 /100 | #259 | Tragic 22.7% |
| Celtics | 0.5 /100 | #260 | Tragic 22.7% |
| Immigrants | Cabo Verde | 0.4 /100 | #261 | Tragic 22.8% |
Demographics Similar to Immigrants from Indonesia by Single Female Poverty
In terms of single female poverty, the demographic groups most similar to Immigrants from Indonesia are Macedonian (18.9%, a difference of 0.16%), Immigrants from Croatia (18.9%, a difference of 0.21%), Latvian (19.0%, a difference of 0.35%), Immigrants from Romania (18.8%, a difference of 0.38%), and Jordanian (18.8%, a difference of 0.53%).
| Demographics | Rating | Rank | Single Female Poverty |
| Tongans | 99.9 /100 | #38 | Exceptional 18.8% |
| Bulgarians | 99.9 /100 | #39 | Exceptional 18.8% |
| Okinawans | 99.9 /100 | #40 | Exceptional 18.8% |
| Immigrants | Serbia | 99.9 /100 | #41 | Exceptional 18.8% |
| Jordanians | 99.9 /100 | #42 | Exceptional 18.8% |
| Immigrants | Romania | 99.9 /100 | #43 | Exceptional 18.8% |
| Immigrants | Croatia | 99.9 /100 | #44 | Exceptional 18.9% |
| Immigrants | Indonesia | 99.8 /100 | #45 | Exceptional 18.9% |
| Macedonians | 99.8 /100 | #46 | Exceptional 18.9% |
| Latvians | 99.8 /100 | #47 | Exceptional 19.0% |
| Immigrants | Argentina | 99.8 /100 | #48 | Exceptional 19.0% |
| Immigrants | Czechoslovakia | 99.8 /100 | #49 | Exceptional 19.0% |
| Immigrants | Eastern Europe | 99.8 /100 | #50 | Exceptional 19.0% |
| Immigrants | Italy | 99.8 /100 | #51 | Exceptional 19.0% |
| Egyptians | 99.7 /100 | #52 | Exceptional 19.1% |