Immigrants from Middle Africa vs Austrian Single Female Poverty
COMPARE
Immigrants from Middle Africa
Austrian
Single Female Poverty
Single Female Poverty Comparison
Immigrants from Middle Africa
Austrians
22.3%
SINGLE FEMALE POVERTY
1.9/ 100
METRIC RATING
244th/ 347
METRIC RANK
20.4%
SINGLE FEMALE POVERTY
85.8/ 100
METRIC RATING
145th/ 347
METRIC RANK
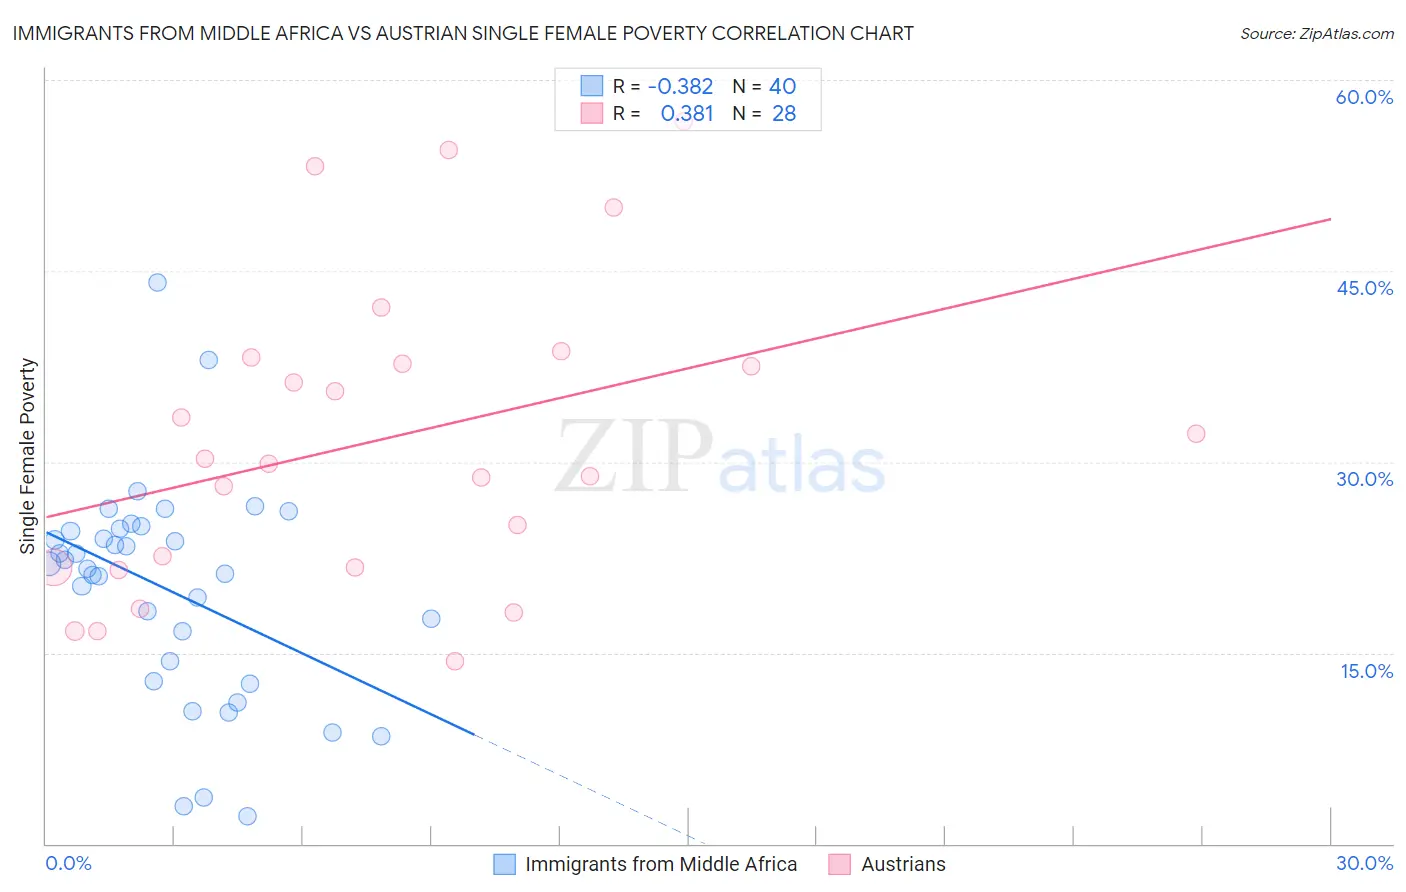
Immigrants from Middle Africa vs Austrian Single Female Poverty Correlation Chart
The statistical analysis conducted on geographies consisting of 201,606,644 people shows a mild negative correlation between the proportion of Immigrants from Middle Africa and poverty level among single females in the United States with a correlation coefficient (R) of -0.382 and weighted average of 22.3%. Similarly, the statistical analysis conducted on geographies consisting of 441,015,533 people shows a mild positive correlation between the proportion of Austrians and poverty level among single females in the United States with a correlation coefficient (R) of 0.381 and weighted average of 20.4%, a difference of 9.2%.
Single Female Poverty Correlation Summary
| Measurement | Immigrants from Middle Africa | Austrian |
| Minimum | 2.2% | 14.3% |
| Maximum | 44.1% | 56.8% |
| Range | 42.0% | 42.4% |
| Mean | 19.9% | 31.8% |
| Median | 21.8% | 30.1% |
| Interquartile 25% (IQ1) | 13.6% | 21.7% |
| Interquartile 75% (IQ3) | 24.6% | 37.9% |
| Interquartile Range (IQR) | 11.1% | 16.2% |
| Standard Deviation (Sample) | 8.6% | 11.9% |
| Standard Deviation (Population) | 8.5% | 11.7% |
Similar Demographics by Single Female Poverty
Demographics Similar to Immigrants from Middle Africa by Single Female Poverty
In terms of single female poverty, the demographic groups most similar to Immigrants from Middle Africa are West Indian (22.3%, a difference of 0.010%), Immigrants from Bangladesh (22.3%, a difference of 0.040%), Bermudan (22.3%, a difference of 0.10%), Cape Verdean (22.3%, a difference of 0.17%), and French (22.2%, a difference of 0.31%).
| Demographics | Rating | Rank | Single Female Poverty |
| Vietnamese | 4.0 /100 | #237 | Tragic 22.0% |
| French Canadians | 2.8 /100 | #238 | Tragic 22.2% |
| Malaysians | 2.8 /100 | #239 | Tragic 22.2% |
| French | 2.3 /100 | #240 | Tragic 22.2% |
| Cape Verdeans | 2.1 /100 | #241 | Tragic 22.3% |
| Bermudans | 2.0 /100 | #242 | Tragic 22.3% |
| West Indians | 1.9 /100 | #243 | Tragic 22.3% |
| Immigrants | Middle Africa | 1.9 /100 | #244 | Tragic 22.3% |
| Immigrants | Bangladesh | 1.8 /100 | #245 | Tragic 22.3% |
| Liberians | 1.4 /100 | #246 | Tragic 22.4% |
| Immigrants | El Salvador | 1.4 /100 | #247 | Tragic 22.4% |
| Belizeans | 1.4 /100 | #248 | Tragic 22.4% |
| Immigrants | Caribbean | 1.3 /100 | #249 | Tragic 22.4% |
| Immigrants | Bahamas | 1.2 /100 | #250 | Tragic 22.5% |
| Immigrants | West Indies | 1.0 /100 | #251 | Tragic 22.5% |
Demographics Similar to Austrians by Single Female Poverty
In terms of single female poverty, the demographic groups most similar to Austrians are Venezuelan (20.4%, a difference of 0.030%), South African (20.4%, a difference of 0.060%), Luxembourger (20.4%, a difference of 0.11%), Immigrants from Uzbekistan (20.3%, a difference of 0.36%), and Australian (20.3%, a difference of 0.37%).
| Demographics | Rating | Rank | Single Female Poverty |
| Slovenes | 90.5 /100 | #138 | Exceptional 20.3% |
| Immigrants | Kuwait | 90.4 /100 | #139 | Exceptional 20.3% |
| Syrians | 90.4 /100 | #140 | Exceptional 20.3% |
| Immigrants | North America | 89.5 /100 | #141 | Excellent 20.3% |
| Immigrants | Uganda | 89.1 /100 | #142 | Excellent 20.3% |
| Australians | 88.4 /100 | #143 | Excellent 20.3% |
| Immigrants | Uzbekistan | 88.3 /100 | #144 | Excellent 20.3% |
| Austrians | 85.8 /100 | #145 | Excellent 20.4% |
| Venezuelans | 85.5 /100 | #146 | Excellent 20.4% |
| South Africans | 85.3 /100 | #147 | Excellent 20.4% |
| Luxembourgers | 84.9 /100 | #148 | Excellent 20.4% |
| Portuguese | 81.5 /100 | #149 | Excellent 20.5% |
| Immigrants | Denmark | 80.5 /100 | #150 | Excellent 20.5% |
| Puget Sound Salish | 79.6 /100 | #151 | Good 20.6% |
| Immigrants | Uruguay | 77.7 /100 | #152 | Good 20.6% |