Immigrants from Yemen vs Austrian Single Female Poverty
COMPARE
Immigrants from Yemen
Austrian
Single Female Poverty
Single Female Poverty Comparison
Immigrants from Yemen
Austrians
28.9%
SINGLE FEMALE POVERTY
0.0/ 100
METRIC RATING
335th/ 347
METRIC RANK
20.4%
SINGLE FEMALE POVERTY
85.8/ 100
METRIC RATING
145th/ 347
METRIC RANK
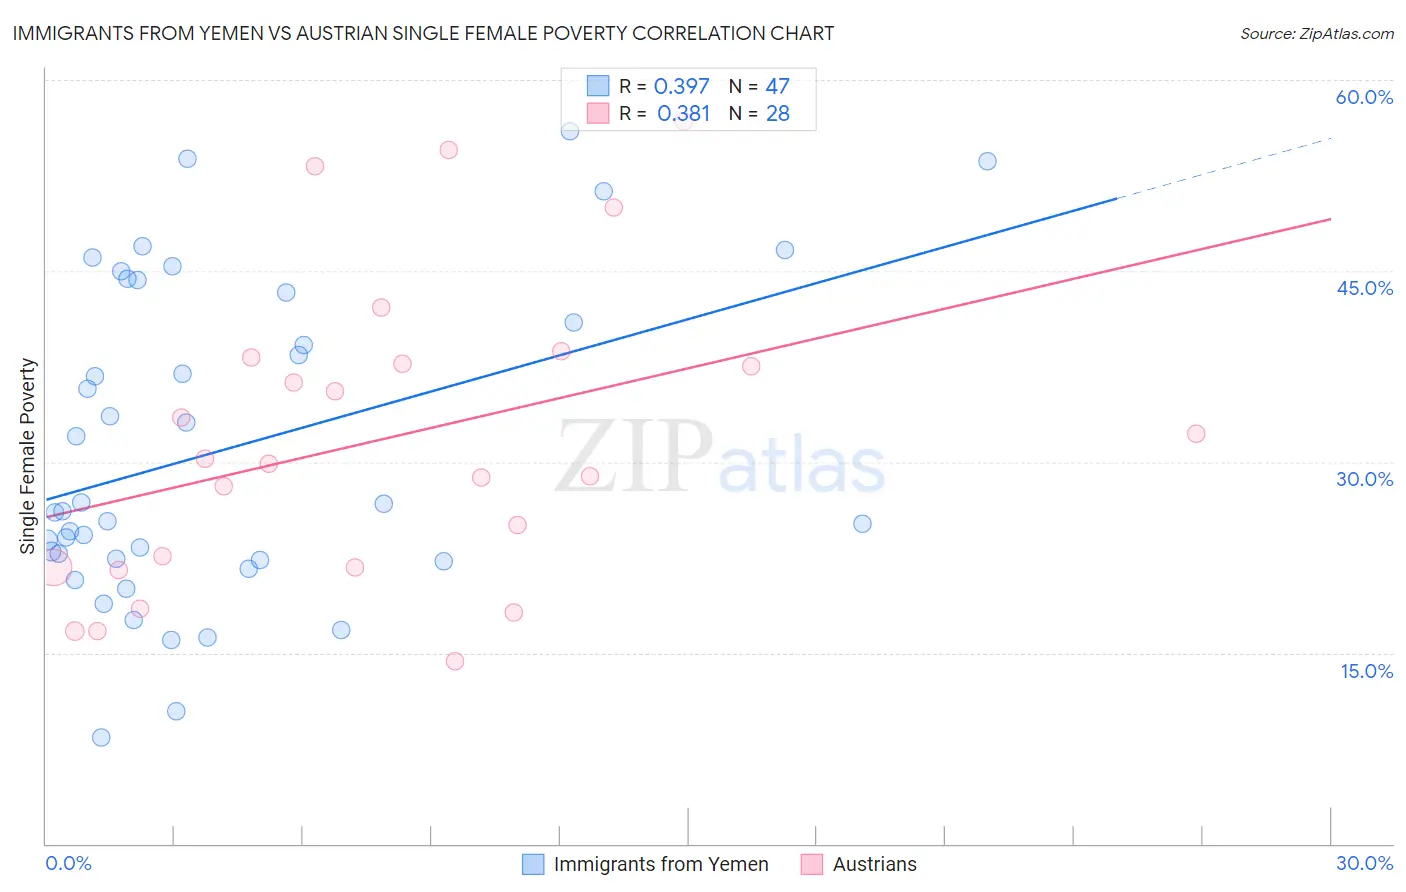
Immigrants from Yemen vs Austrian Single Female Poverty Correlation Chart
The statistical analysis conducted on geographies consisting of 82,238,204 people shows a mild positive correlation between the proportion of Immigrants from Yemen and poverty level among single females in the United States with a correlation coefficient (R) of 0.397 and weighted average of 28.9%. Similarly, the statistical analysis conducted on geographies consisting of 441,015,533 people shows a mild positive correlation between the proportion of Austrians and poverty level among single females in the United States with a correlation coefficient (R) of 0.381 and weighted average of 20.4%, a difference of 41.7%.
Single Female Poverty Correlation Summary
| Measurement | Immigrants from Yemen | Austrian |
| Minimum | 8.3% | 14.3% |
| Maximum | 56.0% | 56.8% |
| Range | 47.7% | 42.4% |
| Mean | 31.0% | 31.8% |
| Median | 26.2% | 30.1% |
| Interquartile 25% (IQ1) | 22.3% | 21.7% |
| Interquartile 75% (IQ3) | 43.3% | 37.9% |
| Interquartile Range (IQR) | 20.9% | 16.2% |
| Standard Deviation (Sample) | 12.3% | 11.9% |
| Standard Deviation (Population) | 12.2% | 11.7% |
Similar Demographics by Single Female Poverty
Demographics Similar to Immigrants from Yemen by Single Female Poverty
In terms of single female poverty, the demographic groups most similar to Immigrants from Yemen are Colville (29.1%, a difference of 0.49%), Pueblo (28.6%, a difference of 1.1%), Yuman (29.4%, a difference of 1.8%), Ute (28.4%, a difference of 1.9%), and Yakama (28.3%, a difference of 2.3%).
| Demographics | Rating | Rank | Single Female Poverty |
| Apache | 0.0 /100 | #328 | Tragic 27.7% |
| Menominee | 0.0 /100 | #329 | Tragic 27.8% |
| Hopi | 0.0 /100 | #330 | Tragic 28.0% |
| Natives/Alaskans | 0.0 /100 | #331 | Tragic 28.2% |
| Yakama | 0.0 /100 | #332 | Tragic 28.3% |
| Ute | 0.0 /100 | #333 | Tragic 28.4% |
| Pueblo | 0.0 /100 | #334 | Tragic 28.6% |
| Immigrants | Yemen | 0.0 /100 | #335 | Tragic 28.9% |
| Colville | 0.0 /100 | #336 | Tragic 29.1% |
| Yuman | 0.0 /100 | #337 | Tragic 29.4% |
| Pima | 0.0 /100 | #338 | Tragic 30.3% |
| Cheyenne | 0.0 /100 | #339 | Tragic 30.4% |
| Cajuns | 0.0 /100 | #340 | Tragic 30.6% |
| Sioux | 0.0 /100 | #341 | Tragic 31.3% |
| Navajo | 0.0 /100 | #342 | Tragic 31.7% |
Demographics Similar to Austrians by Single Female Poverty
In terms of single female poverty, the demographic groups most similar to Austrians are Venezuelan (20.4%, a difference of 0.030%), South African (20.4%, a difference of 0.060%), Luxembourger (20.4%, a difference of 0.11%), Immigrants from Uzbekistan (20.3%, a difference of 0.36%), and Australian (20.3%, a difference of 0.37%).
| Demographics | Rating | Rank | Single Female Poverty |
| Slovenes | 90.5 /100 | #138 | Exceptional 20.3% |
| Immigrants | Kuwait | 90.4 /100 | #139 | Exceptional 20.3% |
| Syrians | 90.4 /100 | #140 | Exceptional 20.3% |
| Immigrants | North America | 89.5 /100 | #141 | Excellent 20.3% |
| Immigrants | Uganda | 89.1 /100 | #142 | Excellent 20.3% |
| Australians | 88.4 /100 | #143 | Excellent 20.3% |
| Immigrants | Uzbekistan | 88.3 /100 | #144 | Excellent 20.3% |
| Austrians | 85.8 /100 | #145 | Excellent 20.4% |
| Venezuelans | 85.5 /100 | #146 | Excellent 20.4% |
| South Africans | 85.3 /100 | #147 | Excellent 20.4% |
| Luxembourgers | 84.9 /100 | #148 | Excellent 20.4% |
| Portuguese | 81.5 /100 | #149 | Excellent 20.5% |
| Immigrants | Denmark | 80.5 /100 | #150 | Excellent 20.5% |
| Puget Sound Salish | 79.6 /100 | #151 | Good 20.6% |
| Immigrants | Uruguay | 77.7 /100 | #152 | Good 20.6% |