Immigrants from Burma/Myanmar vs Immigrants from Scotland Single Female Poverty
COMPARE
Immigrants from Burma/Myanmar
Immigrants from Scotland
Single Female Poverty
Single Female Poverty Comparison
Immigrants from Burma/Myanmar
Immigrants from Scotland
22.6%
SINGLE FEMALE POVERTY
0.8/ 100
METRIC RATING
254th/ 347
METRIC RANK
19.4%
SINGLE FEMALE POVERTY
99.2/ 100
METRIC RATING
81st/ 347
METRIC RANK
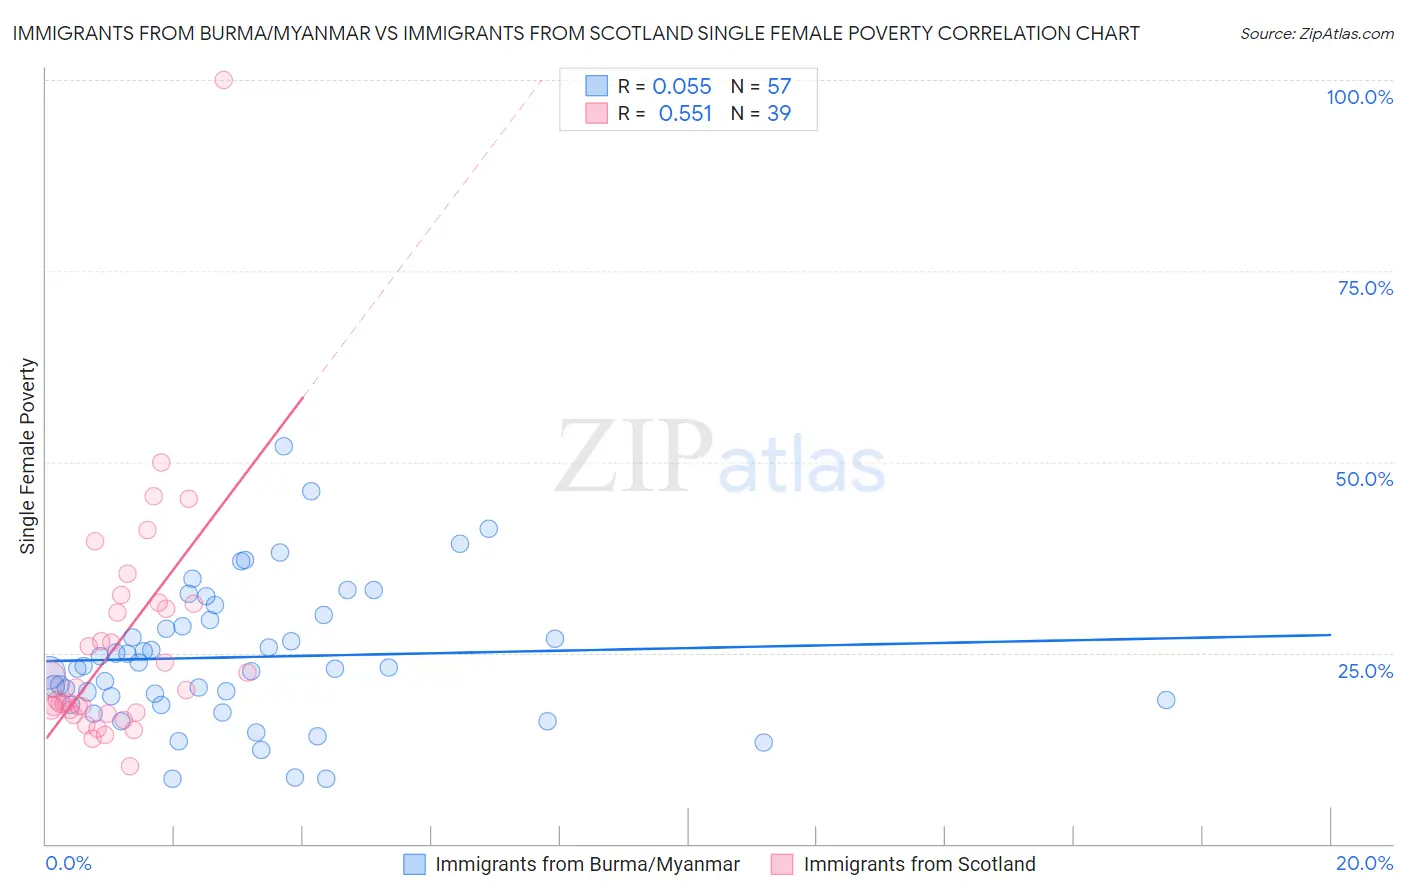
Immigrants from Burma/Myanmar vs Immigrants from Scotland Single Female Poverty Correlation Chart
The statistical analysis conducted on geographies consisting of 171,274,747 people shows a slight positive correlation between the proportion of Immigrants from Burma/Myanmar and poverty level among single females in the United States with a correlation coefficient (R) of 0.055 and weighted average of 22.6%. Similarly, the statistical analysis conducted on geographies consisting of 194,087,969 people shows a substantial positive correlation between the proportion of Immigrants from Scotland and poverty level among single females in the United States with a correlation coefficient (R) of 0.551 and weighted average of 19.4%, a difference of 16.2%.
Single Female Poverty Correlation Summary
| Measurement | Immigrants from Burma/Myanmar | Immigrants from Scotland |
| Minimum | 8.5% | 10.1% |
| Maximum | 52.0% | 100.0% |
| Range | 43.5% | 89.9% |
| Mean | 24.5% | 26.0% |
| Median | 23.1% | 20.2% |
| Interquartile 25% (IQ1) | 18.5% | 17.1% |
| Interquartile 75% (IQ3) | 29.7% | 31.4% |
| Interquartile Range (IQR) | 11.2% | 14.3% |
| Standard Deviation (Sample) | 9.1% | 15.7% |
| Standard Deviation (Population) | 9.1% | 15.5% |
Similar Demographics by Single Female Poverty
Demographics Similar to Immigrants from Burma/Myanmar by Single Female Poverty
In terms of single female poverty, the demographic groups most similar to Immigrants from Burma/Myanmar are Immigrants from Sudan (22.6%, a difference of 0.0%), Immigrants from Liberia (22.5%, a difference of 0.10%), Immigrants from Belize (22.6%, a difference of 0.15%), Delaware (22.5%, a difference of 0.19%), and Sudanese (22.6%, a difference of 0.29%).
| Demographics | Rating | Rank | Single Female Poverty |
| Immigrants | El Salvador | 1.4 /100 | #247 | Tragic 22.4% |
| Belizeans | 1.4 /100 | #248 | Tragic 22.4% |
| Immigrants | Caribbean | 1.3 /100 | #249 | Tragic 22.4% |
| Immigrants | Bahamas | 1.2 /100 | #250 | Tragic 22.5% |
| Immigrants | West Indies | 1.0 /100 | #251 | Tragic 22.5% |
| Delaware | 1.0 /100 | #252 | Tragic 22.5% |
| Immigrants | Liberia | 0.9 /100 | #253 | Tragic 22.5% |
| Immigrants | Burma/Myanmar | 0.8 /100 | #254 | Tragic 22.6% |
| Immigrants | Sudan | 0.8 /100 | #255 | Tragic 22.6% |
| Immigrants | Belize | 0.8 /100 | #256 | Tragic 22.6% |
| Sudanese | 0.7 /100 | #257 | Tragic 22.6% |
| Bahamians | 0.6 /100 | #258 | Tragic 22.7% |
| Whites/Caucasians | 0.6 /100 | #259 | Tragic 22.7% |
| Celtics | 0.5 /100 | #260 | Tragic 22.7% |
| Immigrants | Cabo Verde | 0.4 /100 | #261 | Tragic 22.8% |
Demographics Similar to Immigrants from Scotland by Single Female Poverty
In terms of single female poverty, the demographic groups most similar to Immigrants from Scotland are Immigrants from Malaysia (19.4%, a difference of 0.010%), Immigrants from Australia (19.4%, a difference of 0.020%), Taiwanese (19.4%, a difference of 0.020%), Immigrants from Sierra Leone (19.4%, a difference of 0.060%), and Albanian (19.4%, a difference of 0.080%).
| Demographics | Rating | Rank | Single Female Poverty |
| Immigrants | Belarus | 99.4 /100 | #74 | Exceptional 19.3% |
| Immigrants | Turkey | 99.4 /100 | #75 | Exceptional 19.4% |
| Peruvians | 99.4 /100 | #76 | Exceptional 19.4% |
| Immigrants | Russia | 99.3 /100 | #77 | Exceptional 19.4% |
| Albanians | 99.3 /100 | #78 | Exceptional 19.4% |
| Immigrants | Sierra Leone | 99.3 /100 | #79 | Exceptional 19.4% |
| Immigrants | Australia | 99.3 /100 | #80 | Exceptional 19.4% |
| Immigrants | Scotland | 99.2 /100 | #81 | Exceptional 19.4% |
| Immigrants | Malaysia | 99.2 /100 | #82 | Exceptional 19.4% |
| Taiwanese | 99.2 /100 | #83 | Exceptional 19.4% |
| Immigrants | Sweden | 99.2 /100 | #84 | Exceptional 19.4% |
| Immigrants | Albania | 99.2 /100 | #85 | Exceptional 19.4% |
| Greeks | 99.2 /100 | #86 | Exceptional 19.4% |
| Zimbabweans | 99.0 /100 | #87 | Exceptional 19.5% |
| Afghans | 99.0 /100 | #88 | Exceptional 19.5% |