Immigrants from Burma/Myanmar vs Puget Sound Salish Single Female Poverty
COMPARE
Immigrants from Burma/Myanmar
Puget Sound Salish
Single Female Poverty
Single Female Poverty Comparison
Immigrants from Burma/Myanmar
Puget Sound Salish
22.6%
SINGLE FEMALE POVERTY
0.8/ 100
METRIC RATING
254th/ 347
METRIC RANK
20.6%
SINGLE FEMALE POVERTY
79.6/ 100
METRIC RATING
151st/ 347
METRIC RANK
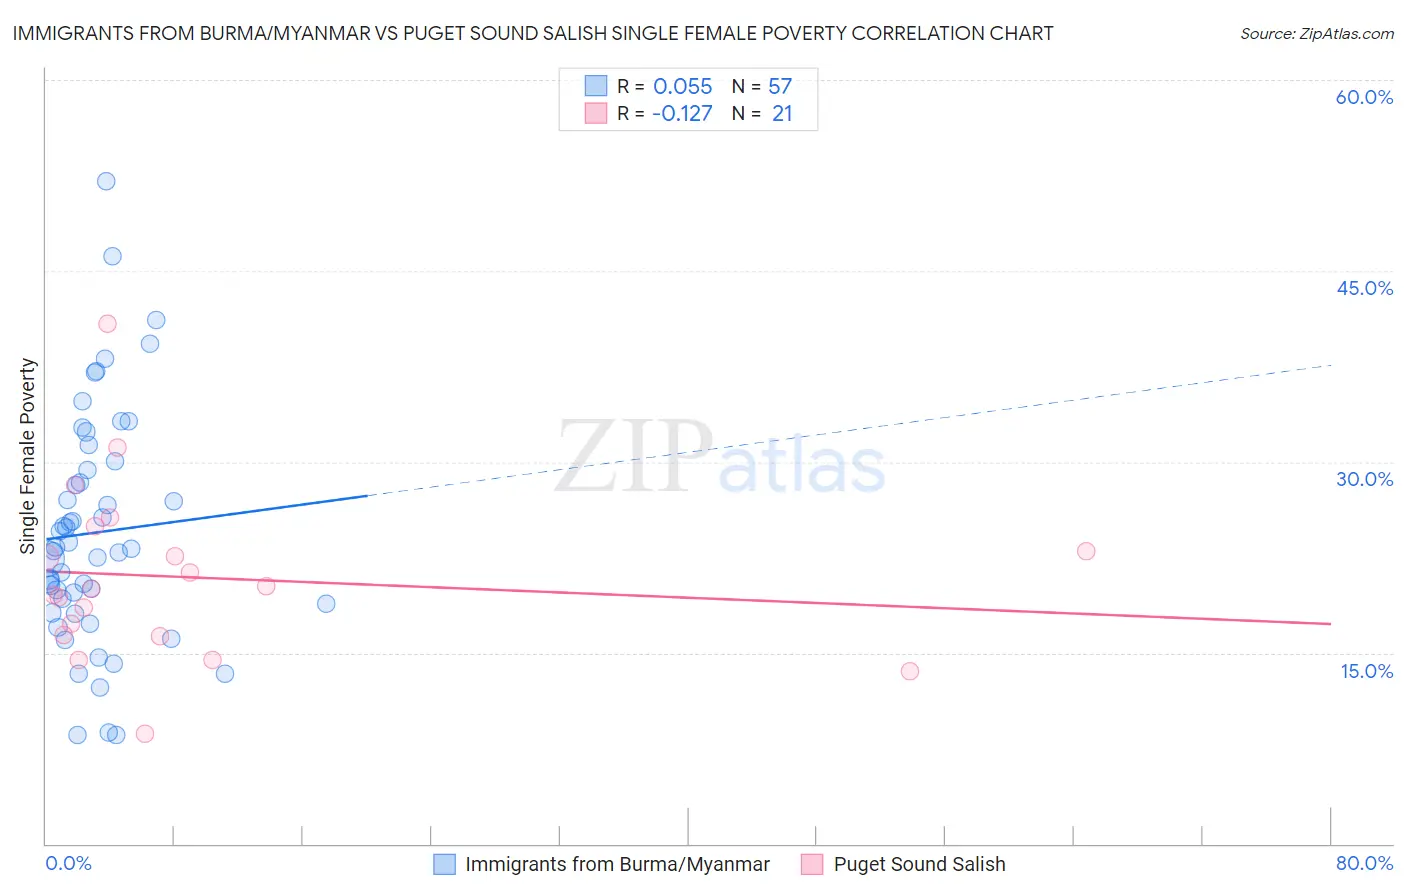
Immigrants from Burma/Myanmar vs Puget Sound Salish Single Female Poverty Correlation Chart
The statistical analysis conducted on geographies consisting of 171,274,747 people shows a slight positive correlation between the proportion of Immigrants from Burma/Myanmar and poverty level among single females in the United States with a correlation coefficient (R) of 0.055 and weighted average of 22.6%. Similarly, the statistical analysis conducted on geographies consisting of 45,841,624 people shows a poor negative correlation between the proportion of Puget Sound Salish and poverty level among single females in the United States with a correlation coefficient (R) of -0.127 and weighted average of 20.6%, a difference of 9.7%.
Single Female Poverty Correlation Summary
| Measurement | Immigrants from Burma/Myanmar | Puget Sound Salish |
| Minimum | 8.5% | 8.6% |
| Maximum | 52.0% | 40.8% |
| Range | 43.5% | 32.2% |
| Mean | 24.5% | 20.9% |
| Median | 23.1% | 20.0% |
| Interquartile 25% (IQ1) | 18.5% | 16.4% |
| Interquartile 75% (IQ3) | 29.7% | 24.0% |
| Interquartile Range (IQR) | 11.2% | 7.6% |
| Standard Deviation (Sample) | 9.1% | 6.9% |
| Standard Deviation (Population) | 9.1% | 6.8% |
Similar Demographics by Single Female Poverty
Demographics Similar to Immigrants from Burma/Myanmar by Single Female Poverty
In terms of single female poverty, the demographic groups most similar to Immigrants from Burma/Myanmar are Immigrants from Sudan (22.6%, a difference of 0.0%), Immigrants from Liberia (22.5%, a difference of 0.10%), Immigrants from Belize (22.6%, a difference of 0.15%), Delaware (22.5%, a difference of 0.19%), and Sudanese (22.6%, a difference of 0.29%).
| Demographics | Rating | Rank | Single Female Poverty |
| Immigrants | El Salvador | 1.4 /100 | #247 | Tragic 22.4% |
| Belizeans | 1.4 /100 | #248 | Tragic 22.4% |
| Immigrants | Caribbean | 1.3 /100 | #249 | Tragic 22.4% |
| Immigrants | Bahamas | 1.2 /100 | #250 | Tragic 22.5% |
| Immigrants | West Indies | 1.0 /100 | #251 | Tragic 22.5% |
| Delaware | 1.0 /100 | #252 | Tragic 22.5% |
| Immigrants | Liberia | 0.9 /100 | #253 | Tragic 22.5% |
| Immigrants | Burma/Myanmar | 0.8 /100 | #254 | Tragic 22.6% |
| Immigrants | Sudan | 0.8 /100 | #255 | Tragic 22.6% |
| Immigrants | Belize | 0.8 /100 | #256 | Tragic 22.6% |
| Sudanese | 0.7 /100 | #257 | Tragic 22.6% |
| Bahamians | 0.6 /100 | #258 | Tragic 22.7% |
| Whites/Caucasians | 0.6 /100 | #259 | Tragic 22.7% |
| Celtics | 0.5 /100 | #260 | Tragic 22.7% |
| Immigrants | Cabo Verde | 0.4 /100 | #261 | Tragic 22.8% |
Demographics Similar to Puget Sound Salish by Single Female Poverty
In terms of single female poverty, the demographic groups most similar to Puget Sound Salish are Immigrants from Denmark (20.5%, a difference of 0.090%), Portuguese (20.5%, a difference of 0.19%), Immigrants from Uruguay (20.6%, a difference of 0.19%), Swedish (20.6%, a difference of 0.24%), and Immigrants from Western Europe (20.6%, a difference of 0.27%).
| Demographics | Rating | Rank | Single Female Poverty |
| Immigrants | Uzbekistan | 88.3 /100 | #144 | Excellent 20.3% |
| Austrians | 85.8 /100 | #145 | Excellent 20.4% |
| Venezuelans | 85.5 /100 | #146 | Excellent 20.4% |
| South Africans | 85.3 /100 | #147 | Excellent 20.4% |
| Luxembourgers | 84.9 /100 | #148 | Excellent 20.4% |
| Portuguese | 81.5 /100 | #149 | Excellent 20.5% |
| Immigrants | Denmark | 80.5 /100 | #150 | Excellent 20.5% |
| Puget Sound Salish | 79.6 /100 | #151 | Good 20.6% |
| Immigrants | Uruguay | 77.7 /100 | #152 | Good 20.6% |
| Swedes | 77.1 /100 | #153 | Good 20.6% |
| Immigrants | Western Europe | 76.7 /100 | #154 | Good 20.6% |
| Samoans | 76.0 /100 | #155 | Good 20.6% |
| South American Indians | 75.7 /100 | #156 | Good 20.6% |
| Immigrants | Oceania | 74.3 /100 | #157 | Good 20.7% |
| Danes | 73.0 /100 | #158 | Good 20.7% |