Immigrants from Bulgaria vs Alsatian In Labor Force | Age 30-34
COMPARE
Immigrants from Bulgaria
Alsatian
In Labor Force | Age 30-34
In Labor Force | Age 30-34 Comparison
Immigrants from Bulgaria
Alsatians
86.0%
IN LABOR FORCE | AGE 30-34
100.0/ 100
METRIC RATING
21st/ 347
METRIC RANK
85.2%
IN LABOR FORCE | AGE 30-34
96.3/ 100
METRIC RATING
105th/ 347
METRIC RANK
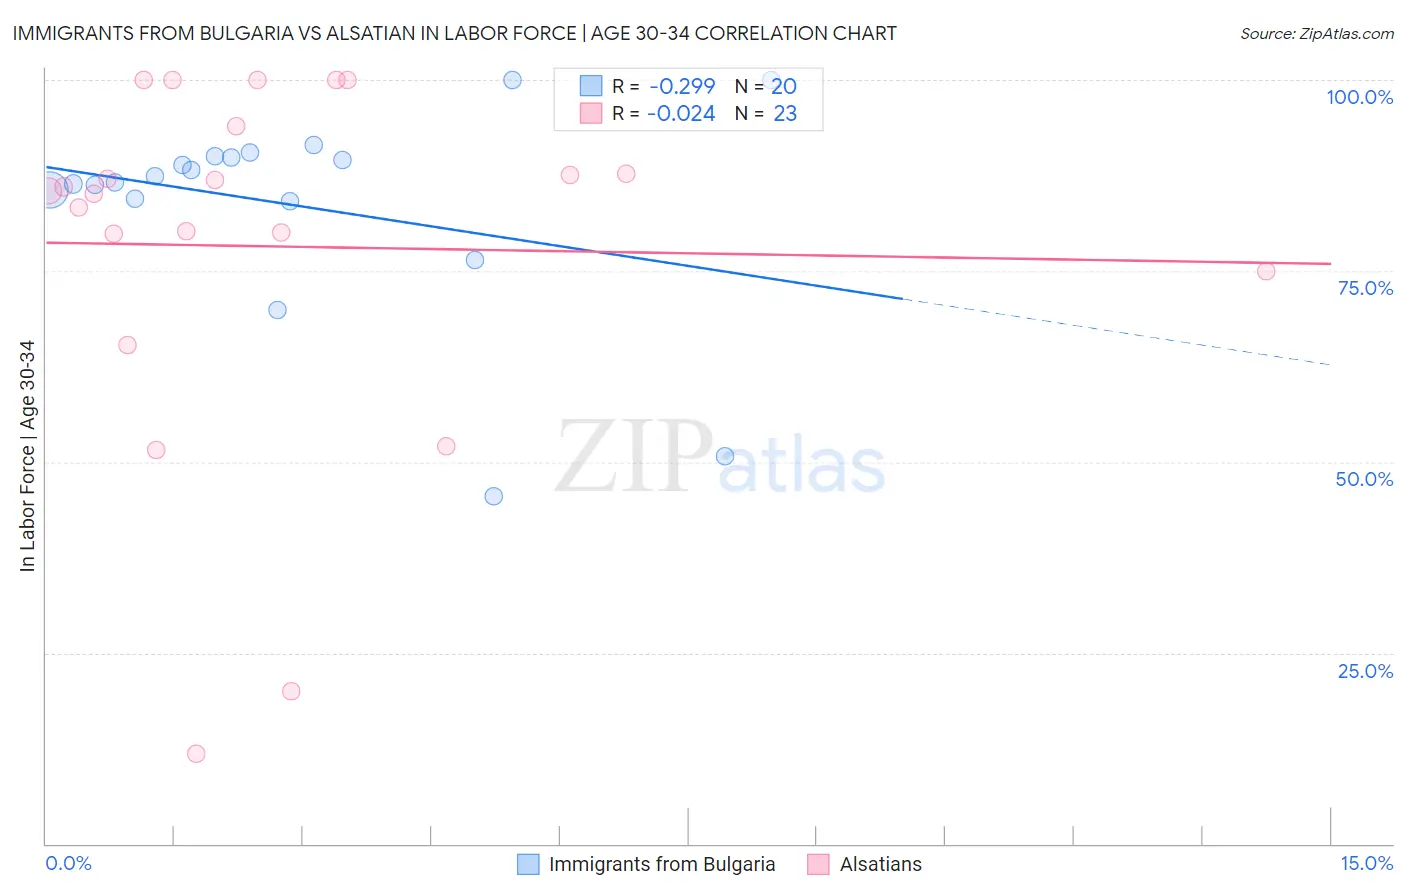
Immigrants from Bulgaria vs Alsatian In Labor Force | Age 30-34 Correlation Chart
The statistical analysis conducted on geographies consisting of 172,547,682 people shows a weak negative correlation between the proportion of Immigrants from Bulgaria and labor force participation rate among population between the ages 30 and 34 in the United States with a correlation coefficient (R) of -0.299 and weighted average of 86.0%. Similarly, the statistical analysis conducted on geographies consisting of 82,678,678 people shows no correlation between the proportion of Alsatians and labor force participation rate among population between the ages 30 and 34 in the United States with a correlation coefficient (R) of -0.024 and weighted average of 85.2%, a difference of 0.93%.
In Labor Force | Age 30-34 Correlation Summary
| Measurement | Immigrants from Bulgaria | Alsatian |
| Minimum | 45.5% | 11.8% |
| Maximum | 100.0% | 100.0% |
| Range | 54.5% | 88.2% |
| Mean | 83.6% | 78.2% |
| Median | 87.0% | 85.5% |
| Interquartile 25% (IQ1) | 84.3% | 75.0% |
| Interquartile 75% (IQ3) | 90.0% | 93.9% |
| Interquartile Range (IQR) | 5.7% | 18.9% |
| Standard Deviation (Sample) | 13.8% | 23.9% |
| Standard Deviation (Population) | 13.5% | 23.3% |
Similar Demographics by In Labor Force | Age 30-34
Demographics Similar to Immigrants from Bulgaria by In Labor Force | Age 30-34
In terms of in labor force | age 30-34, the demographic groups most similar to Immigrants from Bulgaria are Bulgarian (86.0%, a difference of 0.0%), Sierra Leonean (86.0%, a difference of 0.010%), Bermudan (85.9%, a difference of 0.020%), Estonian (85.9%, a difference of 0.030%), and Immigrants from Eritrea (85.9%, a difference of 0.040%).
| Demographics | Rating | Rank | In Labor Force | Age 30-34 |
| Immigrants | Cabo Verde | 100.0 /100 | #14 | Exceptional 86.1% |
| Immigrants | Albania | 100.0 /100 | #15 | Exceptional 86.1% |
| Latvians | 100.0 /100 | #16 | Exceptional 86.0% |
| Immigrants | Cameroon | 100.0 /100 | #17 | Exceptional 86.0% |
| Immigrants | Sierra Leone | 100.0 /100 | #18 | Exceptional 86.0% |
| Sierra Leoneans | 100.0 /100 | #19 | Exceptional 86.0% |
| Bulgarians | 100.0 /100 | #20 | Exceptional 86.0% |
| Immigrants | Bulgaria | 100.0 /100 | #21 | Exceptional 86.0% |
| Bermudans | 100.0 /100 | #22 | Exceptional 85.9% |
| Estonians | 100.0 /100 | #23 | Exceptional 85.9% |
| Immigrants | Eritrea | 100.0 /100 | #24 | Exceptional 85.9% |
| Immigrants | North Macedonia | 100.0 /100 | #25 | Exceptional 85.9% |
| Immigrants | Eastern Africa | 100.0 /100 | #26 | Exceptional 85.9% |
| Immigrants | Liberia | 100.0 /100 | #27 | Exceptional 85.9% |
| Immigrants | Latvia | 100.0 /100 | #28 | Exceptional 85.9% |
Demographics Similar to Alsatians by In Labor Force | Age 30-34
In terms of in labor force | age 30-34, the demographic groups most similar to Alsatians are Immigrants from Middle Africa (85.2%, a difference of 0.0%), Immigrants from Northern Africa (85.2%, a difference of 0.0%), Ukrainian (85.2%, a difference of 0.010%), Immigrants from Ghana (85.2%, a difference of 0.010%), and Immigrants from Austria (85.2%, a difference of 0.020%).
| Demographics | Rating | Rank | In Labor Force | Age 30-34 |
| Immigrants | Uganda | 97.2 /100 | #98 | Exceptional 85.2% |
| Belgians | 97.2 /100 | #99 | Exceptional 85.2% |
| Sudanese | 97.1 /100 | #100 | Exceptional 85.2% |
| Immigrants | Belarus | 96.9 /100 | #101 | Exceptional 85.2% |
| Immigrants | Austria | 96.8 /100 | #102 | Exceptional 85.2% |
| Ukrainians | 96.6 /100 | #103 | Exceptional 85.2% |
| Immigrants | Ghana | 96.5 /100 | #104 | Exceptional 85.2% |
| Alsatians | 96.3 /100 | #105 | Exceptional 85.2% |
| Immigrants | Middle Africa | 96.3 /100 | #106 | Exceptional 85.2% |
| Immigrants | Northern Africa | 96.3 /100 | #107 | Exceptional 85.2% |
| Immigrants | Zimbabwe | 95.8 /100 | #108 | Exceptional 85.1% |
| Argentineans | 95.8 /100 | #109 | Exceptional 85.1% |
| Immigrants | South Africa | 95.3 /100 | #110 | Exceptional 85.1% |
| Immigrants | Scotland | 94.9 /100 | #111 | Exceptional 85.1% |
| Immigrants | Hungary | 94.8 /100 | #112 | Exceptional 85.1% |