Immigrants from Belgium vs Chinese Male Poverty
COMPARE
Immigrants from Belgium
Chinese
Male Poverty
Male Poverty Comparison
Immigrants from Belgium
Chinese
10.3%
MALE POVERTY
96.8/ 100
METRIC RATING
77th/ 347
METRIC RANK
8.7%
MALE POVERTY
100.0/ 100
METRIC RATING
2nd/ 347
METRIC RANK
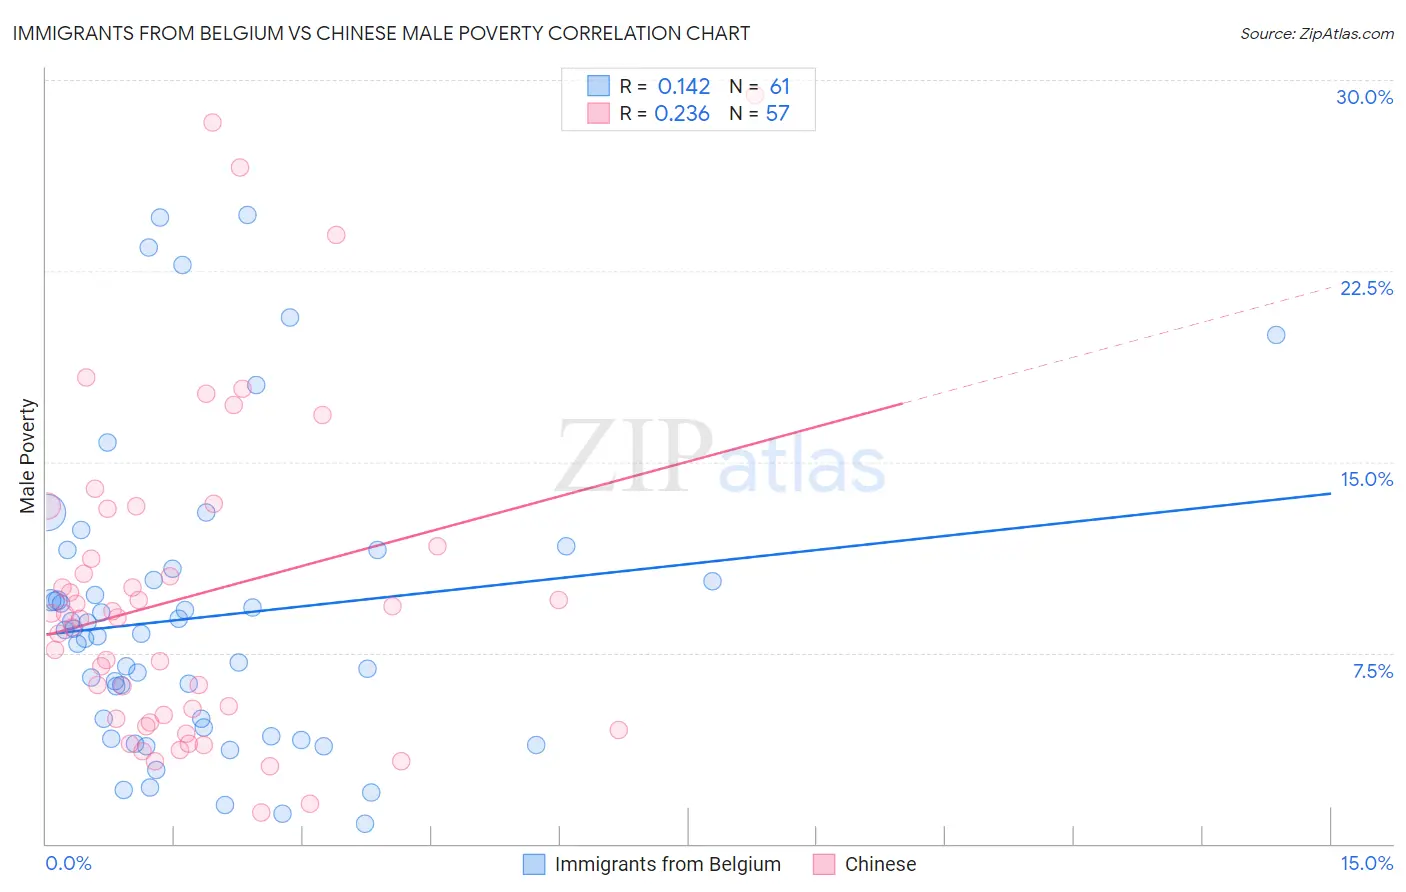
Immigrants from Belgium vs Chinese Male Poverty Correlation Chart
The statistical analysis conducted on geographies consisting of 146,693,310 people shows a poor positive correlation between the proportion of Immigrants from Belgium and poverty level among males in the United States with a correlation coefficient (R) of 0.142 and weighted average of 10.3%. Similarly, the statistical analysis conducted on geographies consisting of 64,801,112 people shows a weak positive correlation between the proportion of Chinese and poverty level among males in the United States with a correlation coefficient (R) of 0.236 and weighted average of 8.7%, a difference of 18.0%.
Male Poverty Correlation Summary
| Measurement | Immigrants from Belgium | Chinese |
| Minimum | 0.79% | 1.3% |
| Maximum | 24.7% | 29.4% |
| Range | 23.9% | 28.2% |
| Mean | 8.9% | 9.7% |
| Median | 8.3% | 8.9% |
| Interquartile 25% (IQ1) | 4.4% | 4.8% |
| Interquartile 75% (IQ3) | 10.6% | 12.4% |
| Interquartile Range (IQR) | 6.2% | 7.6% |
| Standard Deviation (Sample) | 5.8% | 6.4% |
| Standard Deviation (Population) | 5.8% | 6.4% |
Similar Demographics by Male Poverty
Demographics Similar to Immigrants from Belgium by Male Poverty
In terms of male poverty, the demographic groups most similar to Immigrants from Belgium are Irish (10.3%, a difference of 0.020%), Dutch (10.2%, a difference of 0.030%), Immigrants from Eastern Europe (10.2%, a difference of 0.040%), Carpatho Rusyn (10.2%, a difference of 0.040%), and Immigrants from Asia (10.2%, a difference of 0.12%).
| Demographics | Rating | Rank | Male Poverty |
| Paraguayans | 97.1 /100 | #70 | Exceptional 10.2% |
| Europeans | 97.1 /100 | #71 | Exceptional 10.2% |
| Immigrants | Canada | 97.1 /100 | #72 | Exceptional 10.2% |
| Immigrants | Asia | 97.0 /100 | #73 | Exceptional 10.2% |
| Immigrants | Eastern Europe | 96.9 /100 | #74 | Exceptional 10.2% |
| Carpatho Rusyns | 96.9 /100 | #75 | Exceptional 10.2% |
| Dutch | 96.9 /100 | #76 | Exceptional 10.2% |
| Immigrants | Belgium | 96.8 /100 | #77 | Exceptional 10.3% |
| Irish | 96.8 /100 | #78 | Exceptional 10.3% |
| Immigrants | North America | 96.5 /100 | #79 | Exceptional 10.3% |
| English | 96.4 /100 | #80 | Exceptional 10.3% |
| Belgians | 95.9 /100 | #81 | Exceptional 10.3% |
| Egyptians | 95.9 /100 | #82 | Exceptional 10.3% |
| Immigrants | Sweden | 95.7 /100 | #83 | Exceptional 10.3% |
| Czechoslovakians | 95.6 /100 | #84 | Exceptional 10.3% |
Demographics Similar to Chinese by Male Poverty
In terms of male poverty, the demographic groups most similar to Chinese are Thai (8.7%, a difference of 0.080%), Immigrants from Taiwan (8.9%, a difference of 2.4%), Maltese (9.1%, a difference of 4.4%), Assyrian/Chaldean/Syriac (9.1%, a difference of 5.1%), and Immigrants from Ireland (9.1%, a difference of 5.2%).
| Demographics | Rating | Rank | Male Poverty |
| Immigrants | India | 100.0 /100 | #1 | Exceptional 8.2% |
| Chinese | 100.0 /100 | #2 | Exceptional 8.7% |
| Thais | 100.0 /100 | #3 | Exceptional 8.7% |
| Immigrants | Taiwan | 100.0 /100 | #4 | Exceptional 8.9% |
| Maltese | 100.0 /100 | #5 | Exceptional 9.1% |
| Assyrians/Chaldeans/Syriacs | 99.9 /100 | #6 | Exceptional 9.1% |
| Immigrants | Ireland | 99.9 /100 | #7 | Exceptional 9.1% |
| Filipinos | 99.9 /100 | #8 | Exceptional 9.2% |
| Immigrants | South Central Asia | 99.9 /100 | #9 | Exceptional 9.3% |
| Bulgarians | 99.9 /100 | #10 | Exceptional 9.3% |
| Bolivians | 99.9 /100 | #11 | Exceptional 9.4% |
| Immigrants | Bolivia | 99.9 /100 | #12 | Exceptional 9.4% |
| Immigrants | Lithuania | 99.9 /100 | #13 | Exceptional 9.4% |
| Immigrants | North Macedonia | 99.8 /100 | #14 | Exceptional 9.4% |
| Bhutanese | 99.8 /100 | #15 | Exceptional 9.5% |