Immigrants from Belgium vs Liberian Male Poverty

COMPARE

Immigrants from Belgium
Race
Ancestry
AfghanAfricanAlaska NativeAlaskan AthabascanAlbanianAleutAlsatianAmericanApacheArabArapahoArgentineanArmenianAssyrian/Chaldean/SyriacAustralianAustrianBahamianBangladeshiBarbadianBasqueBelgianBelizeanBermudanBhutaneseBlackfeetBolivianBrazilianBritishBritish West IndianBulgarianBurmeseCajunCambodianCanadianCape VerdeanCarpatho RusynCelticCentral AmericanCentral American IndianCherokeeCheyenneChickasawChileanChineseChippewaChoctawColombianColvilleComancheCosta RicanCreeCreekCroatianCrowCubanCypriotCzechCzechoslovakianDanishDelawareDominicanDutchDutch West IndianEastern EuropeanEcuadorianEgyptianEnglishEstonianEthiopianEuropeanFijianFilipinoFinnishFrenchFrench American IndianFrench CanadianGermanGerman RussianGhanaianGreekGuamanian/ChamorroGuatemalanGuyaneseHaitianHmongHonduranHopiHoumaHungarianIcelanderIndian (Asian)IndonesianInupiatIranianIraqiIrishIroquoisIsraeliItalianJamaicanJapaneseJordanianKenyanKiowaKoreanLaotianLatvianLebaneseLithuanianLumbeeLuxembourgerMacedonianMalaysianMalteseMarshalleseMenomineeMexicanMexican American IndianMongolianMoroccanNative HawaiianNavajoNepaleseNew ZealanderNicaraguanNigerianNorthern EuropeanNorwegianOkinawanOsageOttawaPaiutePakistaniPalestinianPanamanianParaguayanPennsylvania GermanPeruvianPimaPolishPortuguesePotawatomiPuebloPuerto RicanPuget Sound SalishRomanianRussianSalvadoranSamoanScandinavianScotch-IrishScottishSeminoleSenegaleseSerbianShoshoneSierra LeoneanSiouxSlavicSlovakSloveneSomaliSouth AfricanSouth AmericanSouth American IndianSoviet UnionSpaniardSpanishSpanish AmericanSpanish American IndianSri LankanSubsaharan AfricanSudaneseSwedishSwissSyrianTaiwaneseThaiTlingit-HaidaTohono O'OdhamTonganTrinidadian and TobagonianTsimshianTurkishU.S. Virgin IslanderUgandanUkrainianUruguayanUteVenezuelanVietnameseWelshWest IndianYakamaYaquiYugoslavianYumanYup'ikZimbabwean
Immigration
NonimmigrantsImmigrantsAfghanistanAfricaAlbaniaArgentinaArmeniaAsiaAustraliaAustriaBahamasBangladeshBarbadosBelarusBelgiumBelizeBoliviaBosnia and HerzegovinaBrazilBulgariaBurma/MyanmarCabo VerdeCambodiaCameroonCanadaCaribbeanCentral AmericaChileChinaColombiaCongoCosta RicaCroatiaCubaCzechoslovakiaDenmarkDominicaDominican RepublicEastern AfricaEastern AsiaEastern EuropeEcuadorEgyptEl SalvadorEnglandEritreaEthiopiaEuropeFijiFranceGermanyGhanaGreeceGrenadaGuatemalaGuyanaHaitiHondurasHong KongHungaryIndiaIndonesiaIranIraqIrelandIsraelItalyJamaicaJapanJordanKazakhstanKenyaKoreaKuwaitLaosLatin AmericaLatviaLebanonLiberiaLithuaniaMalaysiaMexicoMicronesiaMiddle AfricaMoldovaMoroccoNepalNetherlandsNicaraguaNigeriaNorth AmericaNorth MacedoniaNorthern AfricaNorthern EuropeNorwayOceaniaPakistanPanamaPeruPhilippinesPolandPortugalRomaniaRussiaSaudi ArabiaScotlandSenegalSerbiaSierra LeoneSingaporeSomaliaSouth AfricaSouth AmericaSouth Central AsiaSouth Eastern AsiaSouthern EuropeSpainSri LankaSt. Vincent and the GrenadinesSudanSwedenSwitzerlandSyriaTaiwanThailandTrinidad and TobagoTurkeyUgandaUkraineUruguayUzbekistanVenezuelaVietnamWest IndiesWestern AfricaWestern AsiaWestern EuropeYemenZaireZimbabweAzores
Liberian
Race
Ancestry
AfghanAfricanAlaska NativeAlaskan AthabascanAlbanianAleutAlsatianAmericanApacheArabArapahoArgentineanArmenianAssyrian/Chaldean/SyriacAustralianAustrianBahamianBangladeshiBarbadianBasqueBelgianBelizeanBermudanBhutaneseBlackfeetBolivianBrazilianBritishBritish West IndianBulgarianBurmeseCajunCambodianCanadianCape VerdeanCarpatho RusynCelticCentral AmericanCentral American IndianCherokeeCheyenneChickasawChileanChineseChippewaChoctawColombianColvilleComancheCosta RicanCreeCreekCroatianCrowCubanCypriotCzechCzechoslovakianDanishDelawareDominicanDutchDutch West IndianEastern EuropeanEcuadorianEgyptianEnglishEstonianEthiopianEuropeanFijianFilipinoFinnishFrenchFrench American IndianFrench CanadianGermanGerman RussianGhanaianGreekGuamanian/ChamorroGuatemalanGuyaneseHaitianHmongHonduranHopiHoumaHungarianIcelanderIndian (Asian)IndonesianInupiatIranianIraqiIrishIroquoisIsraeliItalianJamaicanJapaneseJordanianKenyanKiowaKoreanLaotianLatvianLebaneseLiberianLithuanianLumbeeLuxembourgerMacedonianMalaysianMalteseMarshalleseMenomineeMexicanMexican American IndianMongolianMoroccanNative HawaiianNavajoNepaleseNew ZealanderNicaraguanNigerianNorthern EuropeanNorwegianOkinawanOsageOttawaPaiutePakistaniPalestinianPanamanianParaguayanPennsylvania GermanPeruvianPimaPolishPortuguesePotawatomiPuebloPuerto RicanPuget Sound SalishRomanianRussianSalvadoranSamoanScandinavianScotch-IrishScottishSeminoleSenegaleseSerbianShoshoneSierra LeoneanSiouxSlavicSlovakSloveneSomaliSouth AfricanSouth AmericanSouth American IndianSoviet UnionSpaniardSpanishSpanish AmericanSpanish American IndianSri LankanSubsaharan AfricanSudaneseSwedishSwissSyrianTaiwaneseThaiTlingit-HaidaTohono O'OdhamTonganTrinidadian and TobagonianTsimshianTurkishU.S. Virgin IslanderUgandanUkrainianUruguayanUteVenezuelanVietnameseWelshWest IndianYakamaYaquiYugoslavianYumanYup'ikZimbabwean
Immigration
NonimmigrantsImmigrantsAfghanistanAfricaAlbaniaArgentinaArmeniaAsiaAustraliaAustriaBahamasBangladeshBarbadosBelarusBelizeBoliviaBosnia and HerzegovinaBrazilBulgariaBurma/MyanmarCabo VerdeCambodiaCameroonCanadaCaribbeanCentral AmericaChileChinaColombiaCongoCosta RicaCroatiaCubaCzechoslovakiaDenmarkDominicaDominican RepublicEastern AfricaEastern AsiaEastern EuropeEcuadorEgyptEl SalvadorEnglandEritreaEthiopiaEuropeFijiFranceGermanyGhanaGreeceGrenadaGuatemalaGuyanaHaitiHondurasHong KongHungaryIndiaIndonesiaIranIraqIrelandIsraelItalyJamaicaJapanJordanKazakhstanKenyaKoreaKuwaitLaosLatin AmericaLatviaLebanonLiberiaLithuaniaMalaysiaMexicoMicronesiaMiddle AfricaMoldovaMoroccoNepalNetherlandsNicaraguaNigeriaNorth AmericaNorth MacedoniaNorthern AfricaNorthern EuropeNorwayOceaniaPakistanPanamaPeruPhilippinesPolandPortugalRomaniaRussiaSaudi ArabiaScotlandSenegalSerbiaSierra LeoneSingaporeSomaliaSouth AfricaSouth AmericaSouth Central AsiaSouth Eastern AsiaSouthern EuropeSpainSri LankaSt. Vincent and the GrenadinesSudanSwedenSwitzerlandSyriaTaiwanThailandTrinidad and TobagoTurkeyUgandaUkraineUruguayUzbekistanVenezuelaVietnamWest IndiesWestern AfricaWestern AsiaWestern EuropeYemenZaireZimbabweAzores
Male Poverty
Income
Poverty
Unemployment
Labor Participation
Family Structure
Vehicle Availability
Education Level
Disability

Male Poverty Comparison

Immigrants from Belgium

Liberians

Exceptional
Tragic
10.3%
MALE POVERTY
96.8/ 100
METRIC RATING
77th/ 347
METRIC RANK
12.8%
MALE POVERTY
0.3/ 100
METRIC RATING
245th/ 347
METRIC RANK

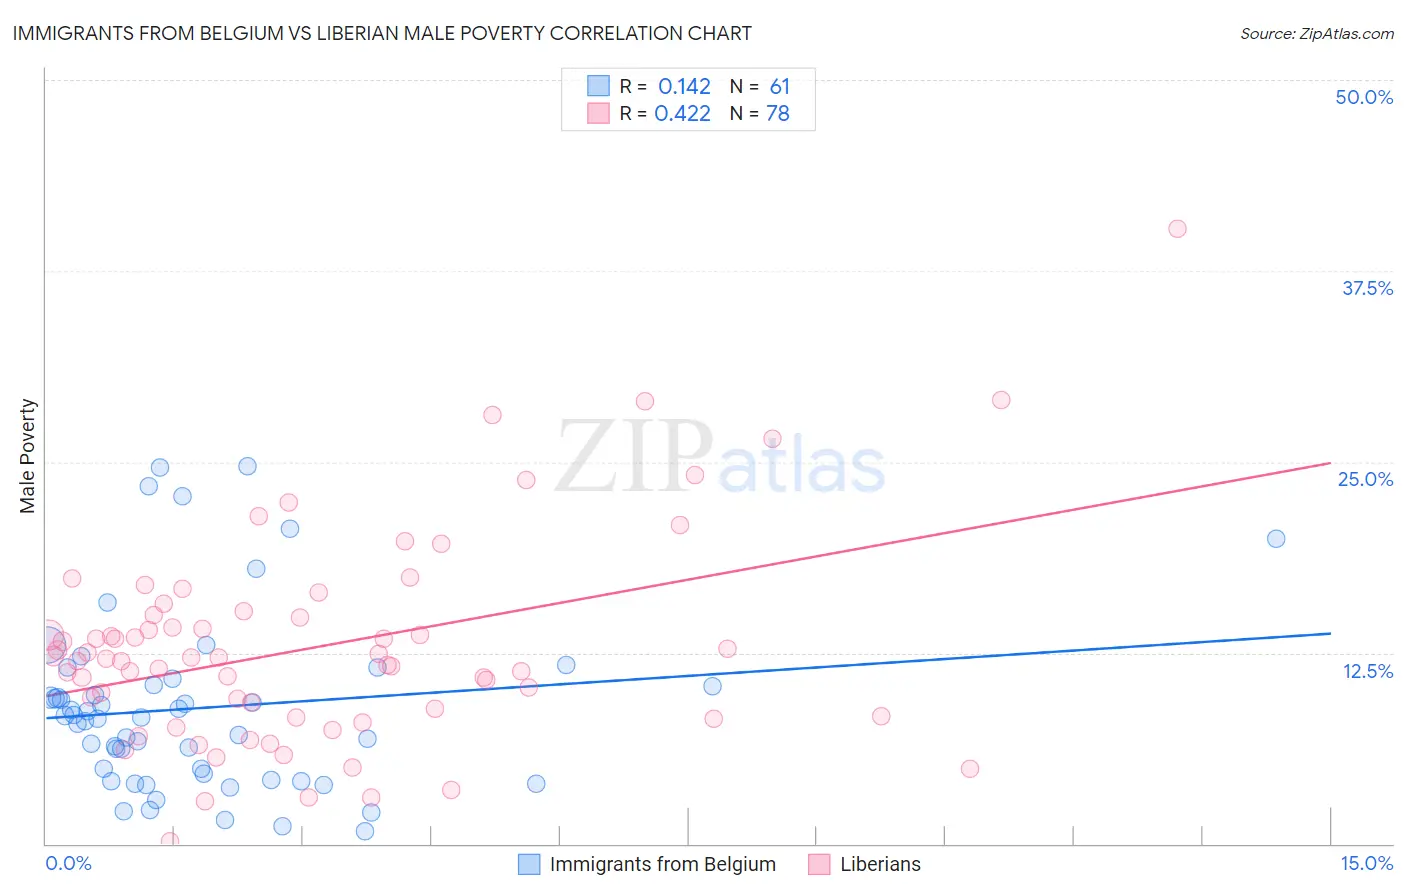
Immigrants from Belgium vs Liberian Male Poverty Correlation Chart

The statistical analysis conducted on geographies consisting of 146,693,310 people shows a poor positive correlation between the proportion of Immigrants from Belgium and poverty level among males in the United States with a correlation coefficient (R) of 0.142 and weighted average of 10.3%. Similarly, the statistical analysis conducted on geographies consisting of 118,033,924 people shows a moderate positive correlation between the proportion of Liberians and poverty level among males in the United States with a correlation coefficient (R) of 0.422 and weighted average of 12.8%, a difference of 24.9%.
Immigrants from Belgium vs Liberian Male Poverty

Male Poverty Correlation Summary

MeasurementImmigrants from BelgiumLiberian
Minimum0.79%0.17%
Maximum24.7%40.3%
Range23.9%40.1%
Mean8.9%12.9%
Median8.3%12.1%
Interquartile 25% (IQ1)4.4%8.4%
Interquartile 75% (IQ3)10.6%15.0%
Interquartile Range (IQR)6.2%6.6%
Standard Deviation (Sample)5.8%6.8%
Standard Deviation (Population)5.8%6.8%

Similar Demographics by Male Poverty

Demographics Similar to Immigrants from Belgium by Male Poverty

In terms of male poverty, the demographic groups most similar to Immigrants from Belgium are Irish (10.3%, a difference of 0.020%), Dutch (10.2%, a difference of 0.030%), Immigrants from Eastern Europe (10.2%, a difference of 0.040%), Carpatho Rusyn (10.2%, a difference of 0.040%), and Immigrants from Asia (10.2%, a difference of 0.12%).
DemographicsRating | RankMale Poverty
Paraguayans
97.1
/100
|
#70
Exceptional
10.2%
Europeans
97.1
/100
|
#71
Exceptional
10.2%
Immigrants | Canada
97.1
/100
|
#72
Exceptional
10.2%
Immigrants | Asia
97.0
/100
|
#73
Exceptional
10.2%
Immigrants | Eastern Europe
96.9
/100
|
#74
Exceptional
10.2%
Carpatho Rusyns
96.9
/100
|
#75
Exceptional
10.2%
Dutch
96.9
/100
|
#76
Exceptional
10.2%
Immigrants | Belgium
96.8
/100
|
#77
Exceptional
10.3%
Irish
96.8
/100
|
#78
Exceptional
10.3%
Immigrants | North America
96.5
/100
|
#79
Exceptional
10.3%
English
96.4
/100
|
#80
Exceptional
10.3%
Belgians
95.9
/100
|
#81
Exceptional
10.3%
Egyptians
95.9
/100
|
#82
Exceptional
10.3%
Immigrants | Sweden
95.7
/100
|
#83
Exceptional
10.3%
Czechoslovakians
95.6
/100
|
#84
Exceptional
10.3%

Demographics Similar to Liberians by Male Poverty

In terms of male poverty, the demographic groups most similar to Liberians are Tsimshian (12.8%, a difference of 0.010%), Alaskan Athabascan (12.8%, a difference of 0.12%), Nepalese (12.8%, a difference of 0.16%), Immigrants from El Salvador (12.8%, a difference of 0.30%), and Sudanese (12.8%, a difference of 0.32%).
DemographicsRating | RankMale Poverty
Ecuadorians
0.4
/100
|
#238
Tragic
12.7%
Ghanaians
0.4
/100
|
#239
Tragic
12.7%
Immigrants | Middle Africa
0.4
/100
|
#240
Tragic
12.7%
Sudanese
0.3
/100
|
#241
Tragic
12.8%
Nepalese
0.3
/100
|
#242
Tragic
12.8%
Alaskan Athabascans
0.3
/100
|
#243
Tragic
12.8%
Tsimshian
0.3
/100
|
#244
Tragic
12.8%
Liberians
0.3
/100
|
#245
Tragic
12.8%
Immigrants | El Salvador
0.2
/100
|
#246
Tragic
12.8%
Immigrants | Western Africa
0.2
/100
|
#247
Tragic
12.9%
Immigrants | Sudan
0.2
/100
|
#248
Tragic
12.9%
Potawatomi
0.2
/100
|
#249
Tragic
12.9%
Immigrants | Nicaragua
0.2
/100
|
#250
Tragic
12.9%
Immigrants | Cuba
0.2
/100
|
#251
Tragic
12.9%
Immigrants | Ecuador
0.2
/100
|
#252
Tragic
12.9%