Immigrants from Belgium vs Chinese Median Household Income
COMPARE
Immigrants from Belgium
Chinese
Median Household Income
Median Household Income Comparison
Immigrants from Belgium
Chinese
$100,306
MEDIAN HOUSEHOLD INCOME
100.0/ 100
METRIC RATING
26th/ 347
METRIC RANK
$98,496
MEDIAN HOUSEHOLD INCOME
100.0/ 100
METRIC RATING
33rd/ 347
METRIC RANK
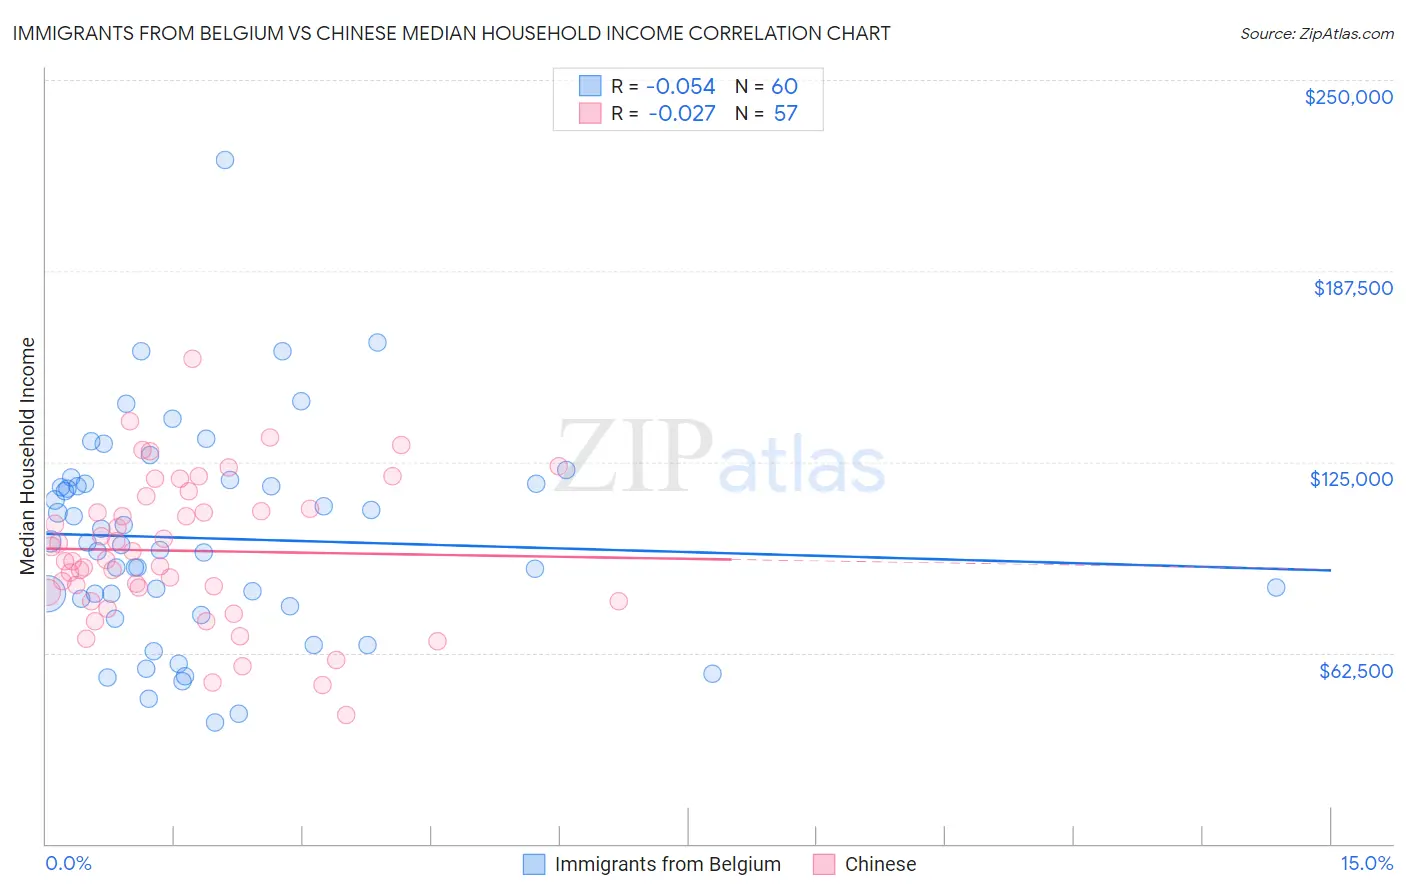
Immigrants from Belgium vs Chinese Median Household Income Correlation Chart
The statistical analysis conducted on geographies consisting of 146,650,493 people shows a slight negative correlation between the proportion of Immigrants from Belgium and median household income in the United States with a correlation coefficient (R) of -0.054 and weighted average of $100,306. Similarly, the statistical analysis conducted on geographies consisting of 64,799,903 people shows no correlation between the proportion of Chinese and median household income in the United States with a correlation coefficient (R) of -0.027 and weighted average of $98,496, a difference of 1.8%.
Median Household Income Correlation Summary
| Measurement | Immigrants from Belgium | Chinese |
| Minimum | $39,542 | $42,222 |
| Maximum | $223,750 | $158,665 |
| Range | $184,208 | $116,443 |
| Mean | $99,959 | $95,906 |
| Median | $98,272 | $92,903 |
| Interquartile 25% (IQ1) | $78,898 | $80,796 |
| Interquartile 75% (IQ3) | $117,778 | $111,792 |
| Interquartile Range (IQR) | $38,881 | $30,996 |
| Standard Deviation (Sample) | $34,343 | $23,711 |
| Standard Deviation (Population) | $34,056 | $23,502 |
Demographics Similar to Immigrants from Belgium and Chinese by Median Household Income
In terms of median household income, the demographic groups most similar to Immigrants from Belgium are Bhutanese ($100,151, a difference of 0.15%), Immigrants from Sri Lanka ($99,943, a difference of 0.36%), Immigrants from Asia ($99,933, a difference of 0.37%), Immigrants from Sweden ($100,699, a difference of 0.39%), and Immigrants from Japan ($100,711, a difference of 0.40%). Similarly, the demographic groups most similar to Chinese are Immigrants from Denmark ($98,510, a difference of 0.010%), Russian ($98,008, a difference of 0.50%), Immigrants from Switzerland ($97,979, a difference of 0.53%), Turkish ($99,389, a difference of 0.91%), and Immigrants from Pakistan ($97,528, a difference of 0.99%).
| Demographics | Rating | Rank | Median Household Income |
| Immigrants | Australia | 100.0 /100 | #19 | Exceptional $102,562 |
| Bolivians | 100.0 /100 | #20 | Exceptional $102,195 |
| Eastern Europeans | 100.0 /100 | #21 | Exceptional $101,781 |
| Asians | 100.0 /100 | #22 | Exceptional $101,681 |
| Immigrants | Bolivia | 100.0 /100 | #23 | Exceptional $101,394 |
| Immigrants | Japan | 100.0 /100 | #24 | Exceptional $100,711 |
| Immigrants | Sweden | 100.0 /100 | #25 | Exceptional $100,699 |
| Immigrants | Belgium | 100.0 /100 | #26 | Exceptional $100,306 |
| Bhutanese | 100.0 /100 | #27 | Exceptional $100,151 |
| Immigrants | Sri Lanka | 100.0 /100 | #28 | Exceptional $99,943 |
| Immigrants | Asia | 100.0 /100 | #29 | Exceptional $99,933 |
| Immigrants | Northern Europe | 100.0 /100 | #30 | Exceptional $99,813 |
| Turks | 100.0 /100 | #31 | Exceptional $99,389 |
| Immigrants | Denmark | 100.0 /100 | #32 | Exceptional $98,510 |
| Chinese | 100.0 /100 | #33 | Exceptional $98,496 |
| Russians | 100.0 /100 | #34 | Exceptional $98,008 |
| Immigrants | Switzerland | 100.0 /100 | #35 | Exceptional $97,979 |
| Immigrants | Pakistan | 100.0 /100 | #36 | Exceptional $97,528 |
| Latvians | 100.0 /100 | #37 | Exceptional $97,311 |
| Immigrants | Indonesia | 100.0 /100 | #38 | Exceptional $97,297 |
| Afghans | 100.0 /100 | #39 | Exceptional $97,026 |