Immigrants from Italy vs Chinese Male Poverty
COMPARE
Immigrants from Italy
Chinese
Male Poverty
Male Poverty Comparison
Immigrants from Italy
Chinese
10.2%
MALE POVERTY
97.8/ 100
METRIC RATING
62nd/ 347
METRIC RANK
8.7%
MALE POVERTY
100.0/ 100
METRIC RATING
2nd/ 347
METRIC RANK
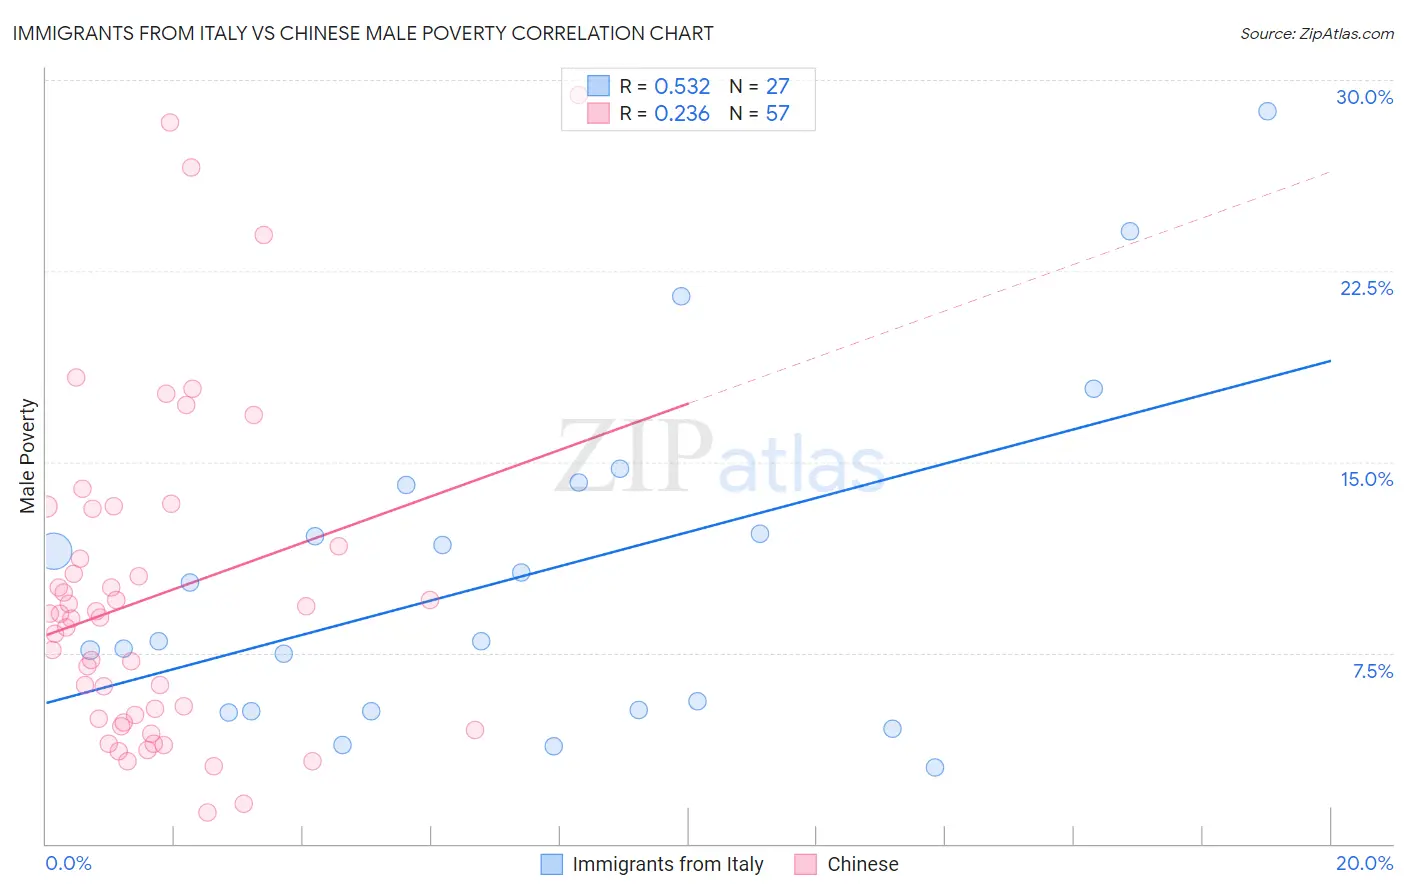
Immigrants from Italy vs Chinese Male Poverty Correlation Chart
The statistical analysis conducted on geographies consisting of 324,012,944 people shows a substantial positive correlation between the proportion of Immigrants from Italy and poverty level among males in the United States with a correlation coefficient (R) of 0.532 and weighted average of 10.2%. Similarly, the statistical analysis conducted on geographies consisting of 64,801,112 people shows a weak positive correlation between the proportion of Chinese and poverty level among males in the United States with a correlation coefficient (R) of 0.236 and weighted average of 8.7%, a difference of 16.9%.
Male Poverty Correlation Summary
| Measurement | Immigrants from Italy | Chinese |
| Minimum | 3.0% | 1.3% |
| Maximum | 28.8% | 29.4% |
| Range | 25.8% | 28.2% |
| Mean | 10.5% | 9.7% |
| Median | 8.0% | 8.9% |
| Interquartile 25% (IQ1) | 5.2% | 4.8% |
| Interquartile 75% (IQ3) | 14.1% | 12.4% |
| Interquartile Range (IQR) | 8.9% | 7.6% |
| Standard Deviation (Sample) | 6.5% | 6.4% |
| Standard Deviation (Population) | 6.4% | 6.4% |
Similar Demographics by Male Poverty
Demographics Similar to Immigrants from Italy by Male Poverty
In terms of male poverty, the demographic groups most similar to Immigrants from Italy are Slovak (10.2%, a difference of 0.040%), Austrian (10.1%, a difference of 0.090%), Ukrainian (10.1%, a difference of 0.11%), Immigrants from Europe (10.1%, a difference of 0.20%), and Swiss (10.2%, a difference of 0.28%).
| Demographics | Rating | Rank | Male Poverty |
| Germans | 98.3 /100 | #55 | Exceptional 10.1% |
| Immigrants | Bulgaria | 98.2 /100 | #56 | Exceptional 10.1% |
| Estonians | 98.1 /100 | #57 | Exceptional 10.1% |
| Scandinavians | 98.0 /100 | #58 | Exceptional 10.1% |
| Immigrants | Europe | 97.9 /100 | #59 | Exceptional 10.1% |
| Ukrainians | 97.9 /100 | #60 | Exceptional 10.1% |
| Austrians | 97.8 /100 | #61 | Exceptional 10.1% |
| Immigrants | Italy | 97.8 /100 | #62 | Exceptional 10.2% |
| Slovaks | 97.7 /100 | #63 | Exceptional 10.2% |
| Swiss | 97.5 /100 | #64 | Exceptional 10.2% |
| Zimbabweans | 97.5 /100 | #65 | Exceptional 10.2% |
| Serbians | 97.5 /100 | #66 | Exceptional 10.2% |
| Immigrants | Netherlands | 97.3 /100 | #67 | Exceptional 10.2% |
| Immigrants | Sri Lanka | 97.2 /100 | #68 | Exceptional 10.2% |
| Immigrants | Australia | 97.1 /100 | #69 | Exceptional 10.2% |
Demographics Similar to Chinese by Male Poverty
In terms of male poverty, the demographic groups most similar to Chinese are Thai (8.7%, a difference of 0.080%), Immigrants from Taiwan (8.9%, a difference of 2.4%), Maltese (9.1%, a difference of 4.4%), Assyrian/Chaldean/Syriac (9.1%, a difference of 5.1%), and Immigrants from Ireland (9.1%, a difference of 5.2%).
| Demographics | Rating | Rank | Male Poverty |
| Immigrants | India | 100.0 /100 | #1 | Exceptional 8.2% |
| Chinese | 100.0 /100 | #2 | Exceptional 8.7% |
| Thais | 100.0 /100 | #3 | Exceptional 8.7% |
| Immigrants | Taiwan | 100.0 /100 | #4 | Exceptional 8.9% |
| Maltese | 100.0 /100 | #5 | Exceptional 9.1% |
| Assyrians/Chaldeans/Syriacs | 99.9 /100 | #6 | Exceptional 9.1% |
| Immigrants | Ireland | 99.9 /100 | #7 | Exceptional 9.1% |
| Filipinos | 99.9 /100 | #8 | Exceptional 9.2% |
| Immigrants | South Central Asia | 99.9 /100 | #9 | Exceptional 9.3% |
| Bulgarians | 99.9 /100 | #10 | Exceptional 9.3% |
| Bolivians | 99.9 /100 | #11 | Exceptional 9.4% |
| Immigrants | Bolivia | 99.9 /100 | #12 | Exceptional 9.4% |
| Immigrants | Lithuania | 99.9 /100 | #13 | Exceptional 9.4% |
| Immigrants | North Macedonia | 99.8 /100 | #14 | Exceptional 9.4% |
| Bhutanese | 99.8 /100 | #15 | Exceptional 9.5% |