Immigrants from Belgium vs Arapaho Male Poverty
COMPARE
Immigrants from Belgium
Arapaho
Male Poverty
Male Poverty Comparison
Immigrants from Belgium
Arapaho
10.3%
MALE POVERTY
96.8/ 100
METRIC RATING
77th/ 347
METRIC RANK
15.1%
MALE POVERTY
0.0/ 100
METRIC RATING
321st/ 347
METRIC RANK
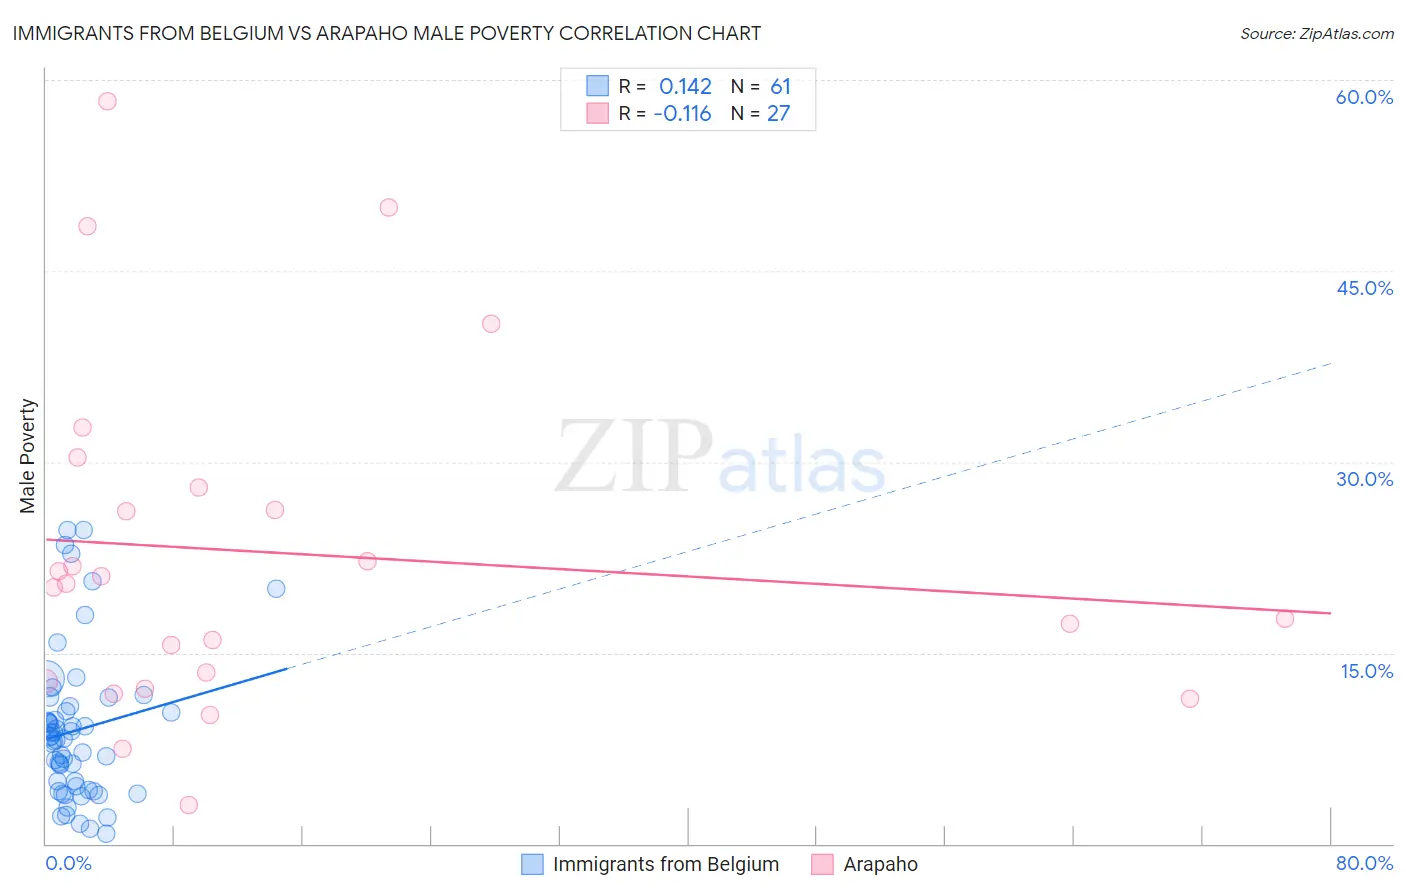
Immigrants from Belgium vs Arapaho Male Poverty Correlation Chart
The statistical analysis conducted on geographies consisting of 146,693,310 people shows a poor positive correlation between the proportion of Immigrants from Belgium and poverty level among males in the United States with a correlation coefficient (R) of 0.142 and weighted average of 10.3%. Similarly, the statistical analysis conducted on geographies consisting of 29,777,916 people shows a poor negative correlation between the proportion of Arapaho and poverty level among males in the United States with a correlation coefficient (R) of -0.116 and weighted average of 15.1%, a difference of 47.1%.
Male Poverty Correlation Summary
| Measurement | Immigrants from Belgium | Arapaho |
| Minimum | 0.79% | 3.0% |
| Maximum | 24.7% | 58.3% |
| Range | 23.9% | 55.3% |
| Mean | 8.9% | 22.8% |
| Median | 8.3% | 20.4% |
| Interquartile 25% (IQ1) | 4.4% | 12.7% |
| Interquartile 75% (IQ3) | 10.6% | 28.0% |
| Interquartile Range (IQR) | 6.2% | 15.3% |
| Standard Deviation (Sample) | 5.8% | 13.5% |
| Standard Deviation (Population) | 5.8% | 13.2% |
Similar Demographics by Male Poverty
Demographics Similar to Immigrants from Belgium by Male Poverty
In terms of male poverty, the demographic groups most similar to Immigrants from Belgium are Irish (10.3%, a difference of 0.020%), Dutch (10.2%, a difference of 0.030%), Immigrants from Eastern Europe (10.2%, a difference of 0.040%), Carpatho Rusyn (10.2%, a difference of 0.040%), and Immigrants from Asia (10.2%, a difference of 0.12%).
| Demographics | Rating | Rank | Male Poverty |
| Paraguayans | 97.1 /100 | #70 | Exceptional 10.2% |
| Europeans | 97.1 /100 | #71 | Exceptional 10.2% |
| Immigrants | Canada | 97.1 /100 | #72 | Exceptional 10.2% |
| Immigrants | Asia | 97.0 /100 | #73 | Exceptional 10.2% |
| Immigrants | Eastern Europe | 96.9 /100 | #74 | Exceptional 10.2% |
| Carpatho Rusyns | 96.9 /100 | #75 | Exceptional 10.2% |
| Dutch | 96.9 /100 | #76 | Exceptional 10.2% |
| Immigrants | Belgium | 96.8 /100 | #77 | Exceptional 10.3% |
| Irish | 96.8 /100 | #78 | Exceptional 10.3% |
| Immigrants | North America | 96.5 /100 | #79 | Exceptional 10.3% |
| English | 96.4 /100 | #80 | Exceptional 10.3% |
| Belgians | 95.9 /100 | #81 | Exceptional 10.3% |
| Egyptians | 95.9 /100 | #82 | Exceptional 10.3% |
| Immigrants | Sweden | 95.7 /100 | #83 | Exceptional 10.3% |
| Czechoslovakians | 95.6 /100 | #84 | Exceptional 10.3% |
Demographics Similar to Arapaho by Male Poverty
In terms of male poverty, the demographic groups most similar to Arapaho are Kiowa (15.2%, a difference of 0.72%), Colville (15.2%, a difference of 1.1%), Menominee (15.3%, a difference of 1.3%), Yakama (15.3%, a difference of 1.5%), and Central American Indian (15.3%, a difference of 1.6%).
| Demographics | Rating | Rank | Male Poverty |
| Immigrants | Honduras | 0.0 /100 | #314 | Tragic 14.6% |
| Chippewa | 0.0 /100 | #315 | Tragic 14.6% |
| British West Indians | 0.0 /100 | #316 | Tragic 14.6% |
| Immigrants | Dominica | 0.0 /100 | #317 | Tragic 14.7% |
| Immigrants | Grenada | 0.0 /100 | #318 | Tragic 14.7% |
| U.S. Virgin Islanders | 0.0 /100 | #319 | Tragic 14.7% |
| Immigrants | Congo | 0.0 /100 | #320 | Tragic 14.7% |
| Arapaho | 0.0 /100 | #321 | Tragic 15.1% |
| Kiowa | 0.0 /100 | #322 | Tragic 15.2% |
| Colville | 0.0 /100 | #323 | Tragic 15.2% |
| Menominee | 0.0 /100 | #324 | Tragic 15.3% |
| Yakama | 0.0 /100 | #325 | Tragic 15.3% |
| Central American Indians | 0.0 /100 | #326 | Tragic 15.3% |
| Paiute | 0.0 /100 | #327 | Tragic 15.8% |
| Blacks/African Americans | 0.0 /100 | #328 | Tragic 15.8% |