German Russian vs Chinese Male Poverty
COMPARE
German Russian
Chinese
Male Poverty
Male Poverty Comparison
German Russians
Chinese
12.2%
MALE POVERTY
2.5/ 100
METRIC RATING
218th/ 347
METRIC RANK
8.7%
MALE POVERTY
100.0/ 100
METRIC RATING
2nd/ 347
METRIC RANK
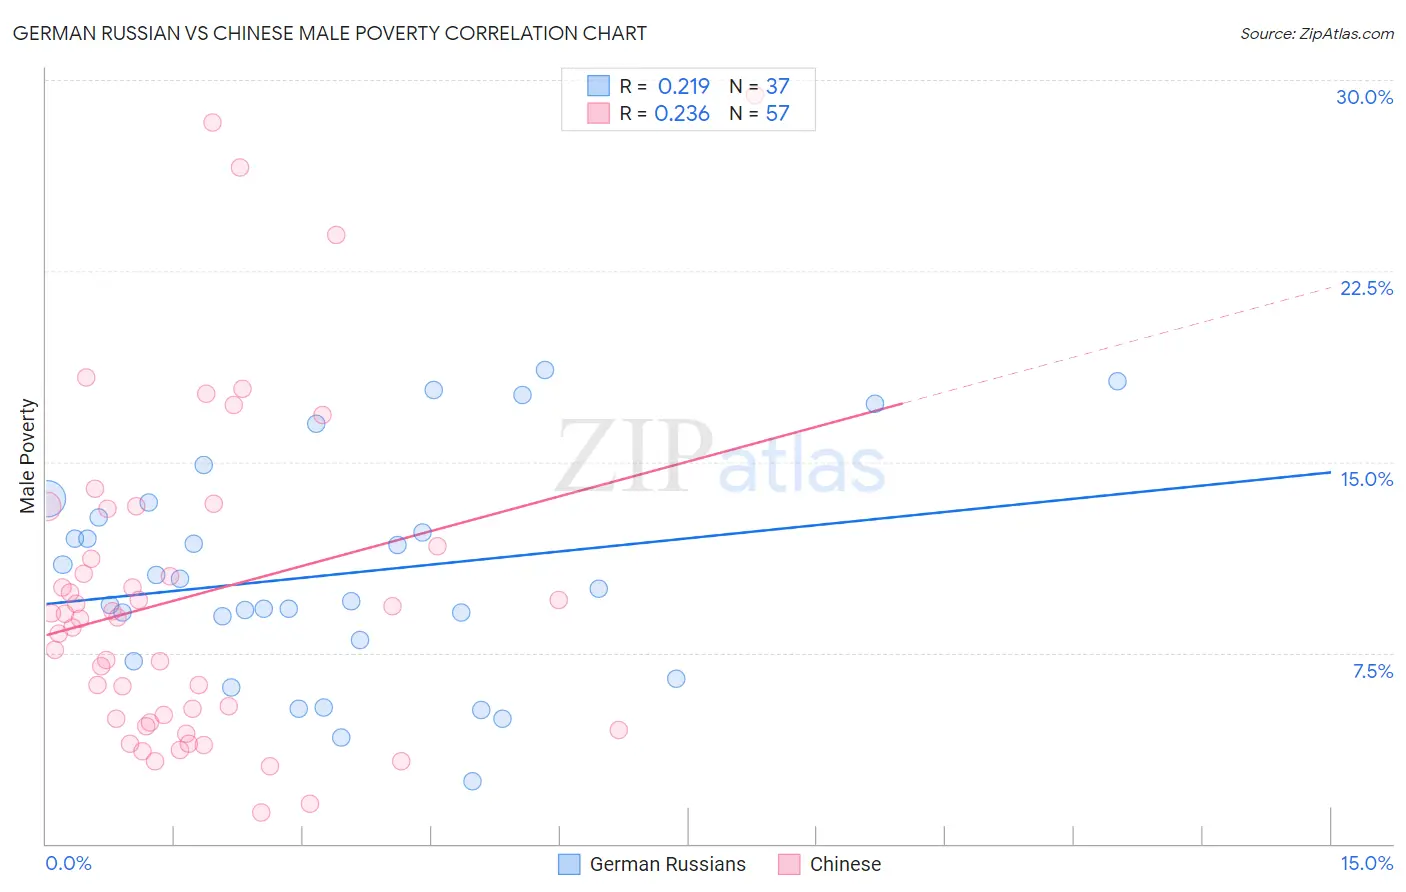
German Russian vs Chinese Male Poverty Correlation Chart
The statistical analysis conducted on geographies consisting of 96,430,864 people shows a weak positive correlation between the proportion of German Russians and poverty level among males in the United States with a correlation coefficient (R) of 0.219 and weighted average of 12.2%. Similarly, the statistical analysis conducted on geographies consisting of 64,801,112 people shows a weak positive correlation between the proportion of Chinese and poverty level among males in the United States with a correlation coefficient (R) of 0.236 and weighted average of 8.7%, a difference of 40.4%.
Male Poverty Correlation Summary
| Measurement | German Russian | Chinese |
| Minimum | 2.5% | 1.3% |
| Maximum | 18.6% | 29.4% |
| Range | 16.2% | 28.2% |
| Mean | 10.6% | 9.7% |
| Median | 10.0% | 8.9% |
| Interquartile 25% (IQ1) | 7.6% | 4.8% |
| Interquartile 75% (IQ3) | 13.1% | 12.4% |
| Interquartile Range (IQR) | 5.5% | 7.6% |
| Standard Deviation (Sample) | 4.2% | 6.4% |
| Standard Deviation (Population) | 4.2% | 6.4% |
Similar Demographics by Male Poverty
Demographics Similar to German Russians by Male Poverty
In terms of male poverty, the demographic groups most similar to German Russians are Immigrants from Thailand (12.2%, a difference of 0.020%), Immigrants from Cambodia (12.2%, a difference of 0.030%), Bermudan (12.2%, a difference of 0.070%), Immigrants from Eritrea (12.2%, a difference of 0.080%), and Immigrants from Uzbekistan (12.2%, a difference of 0.11%).
| Demographics | Rating | Rank | Male Poverty |
| Immigrants | Panama | 4.0 /100 | #211 | Tragic 12.1% |
| Americans | 3.2 /100 | #212 | Tragic 12.1% |
| Immigrants | Nonimmigrants | 3.1 /100 | #213 | Tragic 12.1% |
| Japanese | 2.7 /100 | #214 | Tragic 12.2% |
| Immigrants | Uzbekistan | 2.6 /100 | #215 | Tragic 12.2% |
| Immigrants | Cambodia | 2.5 /100 | #216 | Tragic 12.2% |
| Immigrants | Thailand | 2.5 /100 | #217 | Tragic 12.2% |
| German Russians | 2.5 /100 | #218 | Tragic 12.2% |
| Bermudans | 2.4 /100 | #219 | Tragic 12.2% |
| Immigrants | Eritrea | 2.4 /100 | #220 | Tragic 12.2% |
| Ugandans | 2.2 /100 | #221 | Tragic 12.2% |
| Immigrants | Africa | 2.1 /100 | #222 | Tragic 12.2% |
| Immigrants | Micronesia | 2.1 /100 | #223 | Tragic 12.2% |
| Immigrants | Nigeria | 1.6 /100 | #224 | Tragic 12.3% |
| Osage | 1.5 /100 | #225 | Tragic 12.3% |
Demographics Similar to Chinese by Male Poverty
In terms of male poverty, the demographic groups most similar to Chinese are Thai (8.7%, a difference of 0.080%), Immigrants from Taiwan (8.9%, a difference of 2.4%), Maltese (9.1%, a difference of 4.4%), Assyrian/Chaldean/Syriac (9.1%, a difference of 5.1%), and Immigrants from Ireland (9.1%, a difference of 5.2%).
| Demographics | Rating | Rank | Male Poverty |
| Immigrants | India | 100.0 /100 | #1 | Exceptional 8.2% |
| Chinese | 100.0 /100 | #2 | Exceptional 8.7% |
| Thais | 100.0 /100 | #3 | Exceptional 8.7% |
| Immigrants | Taiwan | 100.0 /100 | #4 | Exceptional 8.9% |
| Maltese | 100.0 /100 | #5 | Exceptional 9.1% |
| Assyrians/Chaldeans/Syriacs | 99.9 /100 | #6 | Exceptional 9.1% |
| Immigrants | Ireland | 99.9 /100 | #7 | Exceptional 9.1% |
| Filipinos | 99.9 /100 | #8 | Exceptional 9.2% |
| Immigrants | South Central Asia | 99.9 /100 | #9 | Exceptional 9.3% |
| Bulgarians | 99.9 /100 | #10 | Exceptional 9.3% |
| Bolivians | 99.9 /100 | #11 | Exceptional 9.4% |
| Immigrants | Bolivia | 99.9 /100 | #12 | Exceptional 9.4% |
| Immigrants | Lithuania | 99.9 /100 | #13 | Exceptional 9.4% |
| Immigrants | North Macedonia | 99.8 /100 | #14 | Exceptional 9.4% |
| Bhutanese | 99.8 /100 | #15 | Exceptional 9.5% |